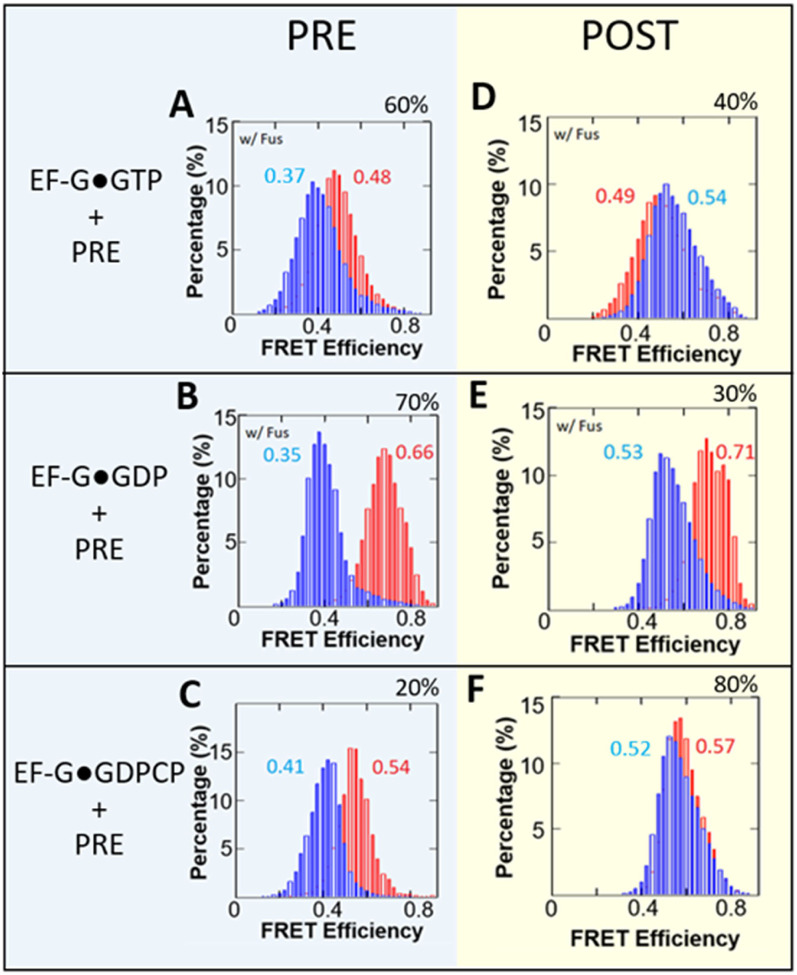
Figure 2.
smFRET efficiency histograms for M5 EF-G catalyzed translocation. Red histograms represent conformational changes within EF-G while blue histograms represent the changes between RbL27-tRNA. Combined histograms are from a singular experiment. (A-C) FRET efficiency histograms for pre-translocation ribosome-bound with labeled EF-G. (D-F) FRET efficiency histograms for post-translocation ribosome-bound with labeled EF-G. (A,D) Experiments with EF-G•GTP; (B,E) Experiments with EF-G•GDP; (C,F) Experiments with EF-G•GDPCP. Experiments with EF-G•GTP and EF-G•GDP employed fusidic acid (Fus) to stabilize EF-G binding on the complexes. Ribosomal subpopulations of pre- or post-translocated ribosomes, expressed as a percentage, were obtained via sorting using predetermined FRET efficiencies for each state. The percentages are the ribosome translocation yields under EF-G in complex with the different nucleotides. The particle counts for the FRET efficiency histograms can be found in Table S1.

