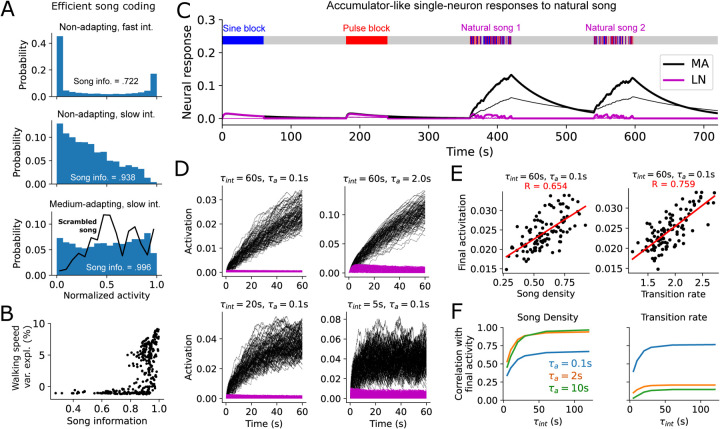
Fig. 3. Compression and dynamical properties of single MA neurons in response to natural song.
A. Histogram of normalized activity for three example neurons (top: τint =0.5s,τa =∞,xs = xp =0.5, middle: τint =120s,τa =∞,xs = xp =0.5, bottom: τint =60s,τa =10s,xs =1,xp =0) in response to 87 courtship songs (16 bins). Song information (given by response entropy [Eq. 4]) is reported relative to the entropy of a uniform distribution. Black line in bottom panel shows activity distribution in response to temporally scrambled songs (song information ≈ .943 for the scrambled song). B. Walking speed variance explained by single MA neuron responses to song vs song information retained in the MA neuron response (each point corresponds to one set of MA neuron parameters). C. Responses of 2 model MA neurons and their LN equivalents to a pure-sine block, a pure pulse-block, and 2 natural song segments. Thick trace: τint =60s,τa =2s,xs = xp =0.5, thin trace: τint =120s,τa =0.5s,xs =0,xp =1. D. Responses of 4 example mixed-selectivity (xs = xp =0.5) MA and equivalent LN neurons with different time constants to 108 different 1-minute song segments. E. Correlation of final neural activation after 1-minute natural song segment with two basic song features for the upper left neuron in D. Each black point corresponds to a different natural song segment. F. Correlations in E vs τint for three different values of τa, with xs = xp = .5.

