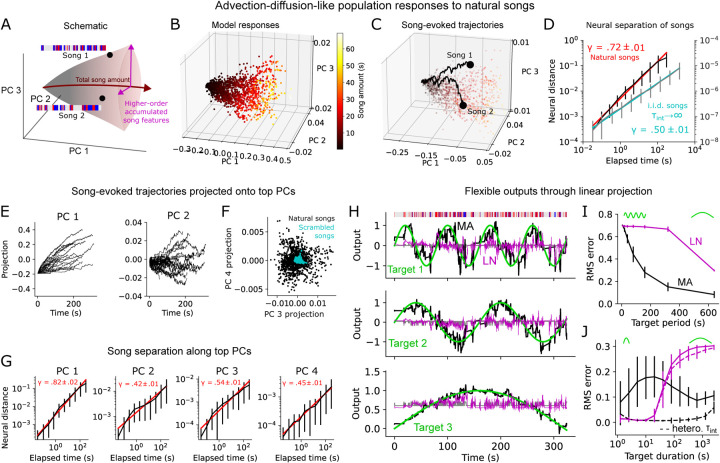
Fig. 4. Advection-diffusion-like population trajectories as a general-purpose mnemonic representation.
A. Schematic of population song representation from a fastadapt/slow-integrate MA population. B. Responses of example 20-neuron MA population to randomly selected song segments spanning a range of durations, projected onto top 3 PCs of the song responses. In B-I parameters were set to be τint =120s for all neurons, τa uniformly distributed between 100ms and 2s, and xs,xp uniformly distributed between 0 and 1. C. Advection-diffusion-like population neural trajectories evoked by two example 30-second song segments. D. Euclidean distance in neural space between trajectories evoked by randomly selected 5-minute songs as a function of elapsed time (black). 57 5-minute songs were used (the full set was not used as many sessions ended before 5 minutes). Error bars show standard deviation across song pairs (100 pairs). Gray traces show same results for artificial i.i.d. songs 25 minutes long, using the same 20-neuron MA population except with τint =106 (with τint →∞ representing an idealized version of this neural code). γ indicates mean and standard deviation of slope of best fit line on log-log plot (computed over 30 random selections of 100 song pairs). E. Example natural-song-evoked trajectories projected onto top PCs. F. Projections of song-evoked population responses (endpoints of trajectories) onto PCs 3 and 4, and comparison with scrambled songs. G. As in D but after projecting trajectories onto each of the top 4 PCs. H. Linear projections of song-evoked MA or equivalent LN population trajectories trained (Ridge Regression; α =10−15) to reproduce three sine waves of varying frequency. Gray trace corresponds to target approximation directly from linear weighting of song inputs (binary sine and pulse inputs). I. Root-mean-squared error between target and prediction for 320s song segments at varying target periods using either MA or equivalent LN model. Error bars show standard deviation across 54 songs. J. As in I, except predicting targets from MA, LN trajectories generated by song segments of varying duration, with each target corresponding to a sine wave with half-period equal to the song segment duration. Dashed lines are populations with 20s ≤ τint ≤120s. Error bars as in I.

