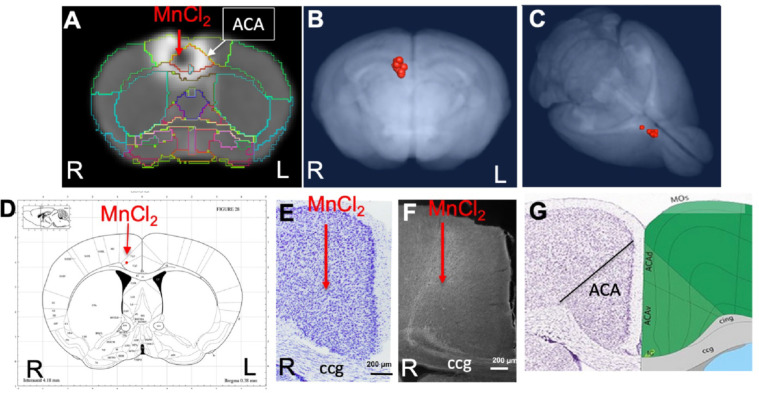
Fig. 2. ACA injection site analysis.
A) Coronal slice from a single animal with our InVivo Atlas overlaid. Mn(II) high concentration at center of the injection appears black with a halo of lower Mn(II) concentrations around it. Atlas identifies the injection site in this living mouse as within the ACA. Injection was into the right cortex, with the mouse facing towards the viewer.
B-C) Center of the injection sites in all 12 mice projected onto a 3D volumetric image of the mouse brain from our muse-template aligned to this dataset.
D) Screenshot from the online Paxinos atlas (http://labs.gaidi.ca/mouse-brain-atlas/) with average coordinates from the MnCl2 injection site analysis placed onto the atlas as a red dot. These coordinates appear precisely as in our digital InVivo Atlas, within the ACA which in this atlas is labelled Cg1 and Cg2 for cingulate gyrus.
E) A section through the ACA from a single mouse in this dataset stained by Nissl. No injection site can be identified. Corpus callosum (ccg).
F) Rhodamine fluorescence identifies neuronal processes emanating out of the ACA with no clear injection bolus. Projection go both into the cortex and down into fiber tracts of the corpus callosum (ccg) and cingulum bundle (Bubb et al., 2018).
G) A screenshot of same region segmented and annotated from the Allen Institute Mouse Brain Reference Atlas. The ACA is sub-segmented and both ccg and cingulum bundle (cing) labelled (Lein et al., 2007).

