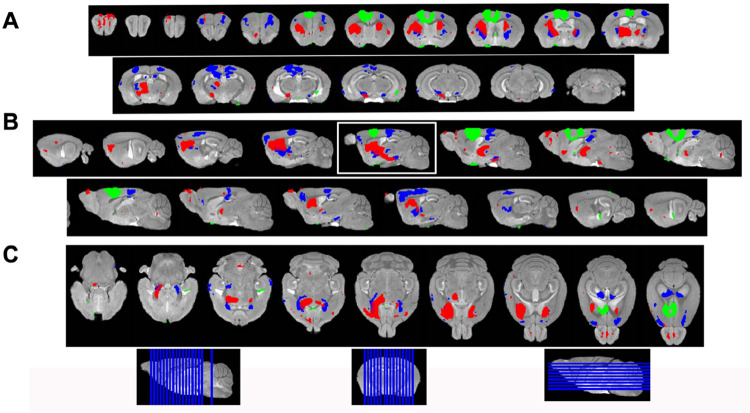
Fig. 4. Statistical parametric mapping shows progress of Mn(II)-dependent intensities across time points.
A) Coronal slices of SPM maps from each time point overlaid on the high definition template shown left to right in the figure from anterior to posterior at 0.5mm intervals.
B) Sagittal slices at 0.5mm intervals taken from slices right to left side of the brain shown going left to right in the figure.
C) Axial slices from ventral to dorsal at 0.5mm intervals, shown left to right in the figure.
Green, 30min > pre-Mn(II); Red, 6hr > 30m; Blue, 24h > 30m.
Slice positions diagrammed at bottom of the figure on the whole brain 3D image.

