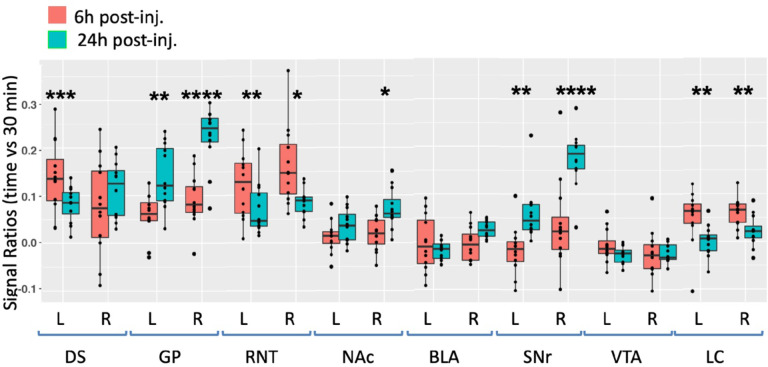
Fig. 5. Degrees of intensity changes in regions of interest (ROI) over time after ACA forebrain injection.
Measurements of intensity values in 3×3×3 voxels selected in dorsal striatum (DS), globus pallidus (GP), reticular nucleus of the thalamus (RTN), nucleus accumbens (NAc), basolateral amygdala (BLA), substantia nigra reticulata (SNr), ventral tegmental area (VTA) and locus coeruleus (LC). Both contralateral (left, L) and ipsilateral (right, R) were measured in the 30m, 6h and 24h images. Intensity values were calculated as a ratio at 6h (orange) or 24h (green) over that of the 30m images. Box and whisker plots are shown with individual values projected as scatter plots. Some median values increased between 6h and 24h and other decreased. Outliers greater than 2 standard deviations are shown in the scatter plot and included in the statistics. Statistical significance of comparisons by linear mixed model between 6h and 24h intensities regardless of directionality as indicated: * p < 0.01; ** p <0.01; *** p < 0.0001, **** p < 0.00001.

