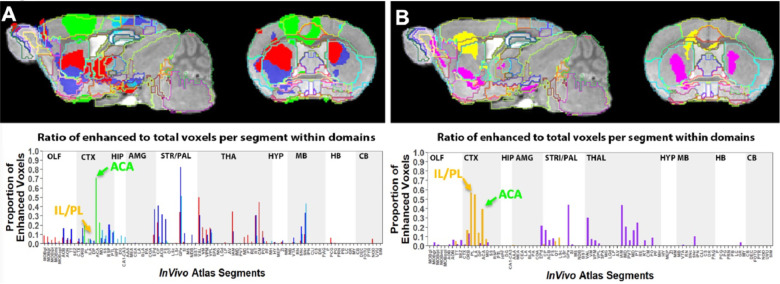
Fig. 6. Comparison of projection maps from ACA with IL/PL by visual inspection of within group statistical maps and segment-wise volumetric column graphs.
A) Slices from voxel-wise brain-wide maps of the anatomy of statistically enhanced voxels after ACA forebrain injection projected onto a grayscale image of our high definition template are shown: Green, 30m > pre-Mn(II) (T = 4.05); Red, 6hr > 30m (T = 3.91); Blue, 24h > 30m (T = 3.57); Turquoise, 24h > 6h (T= 3.97) (p < 0.05 FDR for all comparisons). In this overlay, images are layered on the template in the following order: 24h > 6h, 24h > 30m; 6h >30m; 30m > pre-Mn(II) with the InVivo Atlas v10.2 segmentation delineated on the top layer.
B) Similar overlays but for the IL/PL injections, with Yellow, 30m > pre-Mn(II) (T = 4.78); Pink, 24h > 30m (T = 4.8) (p < 0.05 FDR for both).

