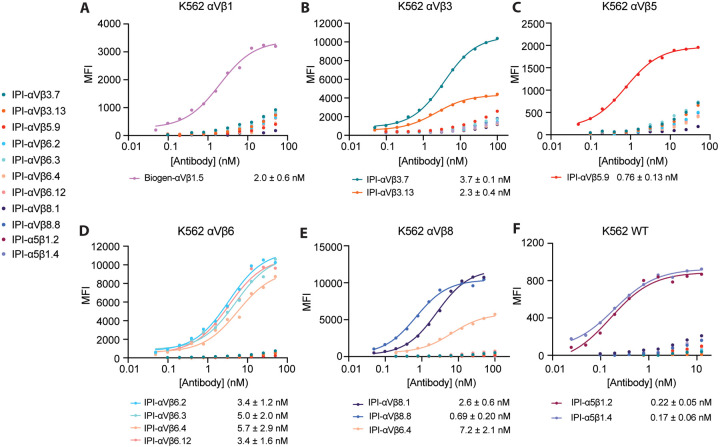
Figure 2.
Titration of antibodies on human RGD-binding integrin K562 stable transfectants by indirect flow cytometry. All antibodies were titrated against each transfectant in Ca2+/Mg2+ and immunostaining was as in Figure 1. The mean fluorescent intensity (MFI) at each antibody concentration after subtraction of isotype control at the same concentration was fitted to a three-parameter dose-response curve for EC50, background MFI, and maximum MFI; curves are only shown for antibodies with meaningful staining. The errors for the EC50 values are the standard errors from the non-linear least square fits.

