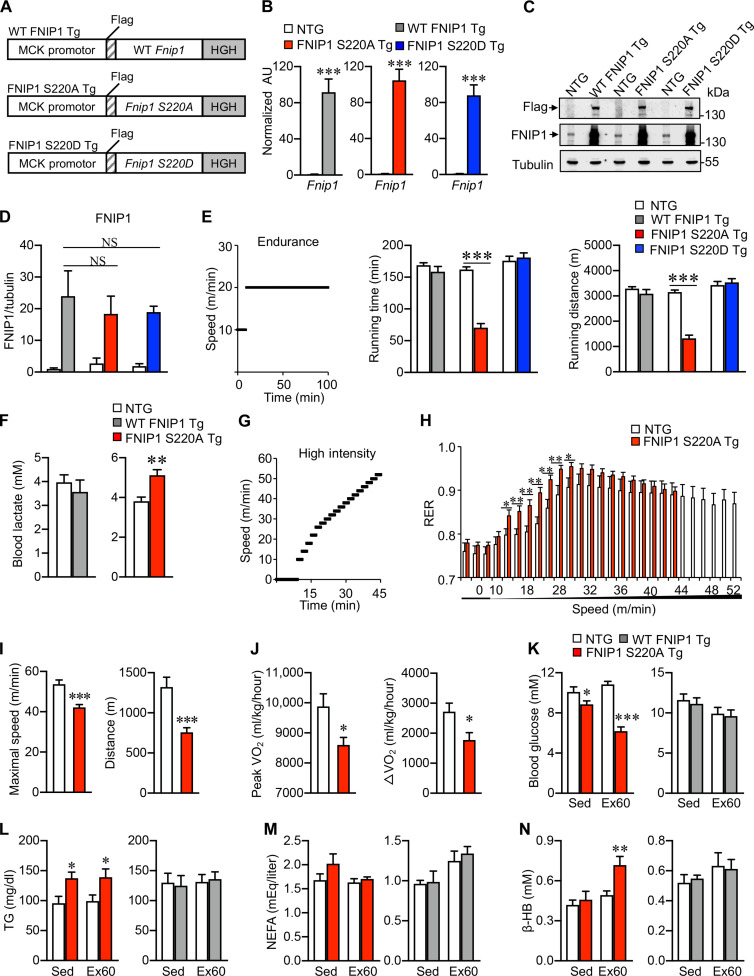
Fig. 3. FNIP1 (S220) phosphorylation by AMPK regulates mitochondrial function and exercise performance in mice.
(A) Schematic diagram depicting the Mck-driven WT Fnip1, S220A, and S220D transgenes. HGH, human growth hormone. (B) Quantitative reverse transcription polymerase chain reaction (RT-PCR) analysis of mRNA levels of Fnip1 transgenes from the gastrocnemius (GC) muscle of the indicated transgenic (Tg) mice. n = 5 to 12 mice per group. (C) Endogenous and Tg FNIP1 expression in muscle tissues. Representative immunoblotting analysis of protein extracts from the WV muscles of the indicated Tg mice with the indicated antibodies. n = 3 mice per group. (D) Quantification of FNIP1 by signal ratios normalized to tubulin. (E) Exercise endurance test in Fnip1 Tg mice. Left: A schematic depicting increments of speed over time. Middle and right: Bars represent the mean running time and distance for the indicated Tg mice on a motorized treadmill. n = 6 to 13 mice per group. (F) Blood lactate levels in WT FNIP1 Tg, S220A Tg, and NTG controls. n = 3 to 13 mice per group. (G to J) Exercise capacity test for Fnip1 Tg mice. n = 6 to 10 mice per group. The schematic depicts the increments of speed over time (G). The RER during a graded exercise regimen (H), Maximal speed and total distance (I) as well as peak VO2 and peak ΔVO2 during exercise (J). (K to N) Blood glucose (K), TG (L), NEFA (M), and β-HB (N) levels at rest (Sed) or after 60 min of exercise (Ex60). n = 4 to 9 mice per group. Error bars are shown as the means ± SEM. *P < 0.05; **P < 0.01; ***P < 0.001. NS, not significant. The P value was determined by Student’s t test [(B), (E), (F), and (H) to (J)] or one-way ANOVA coupled to Fisher’s LSD post hoc test [(D) and (K) to (N)].

