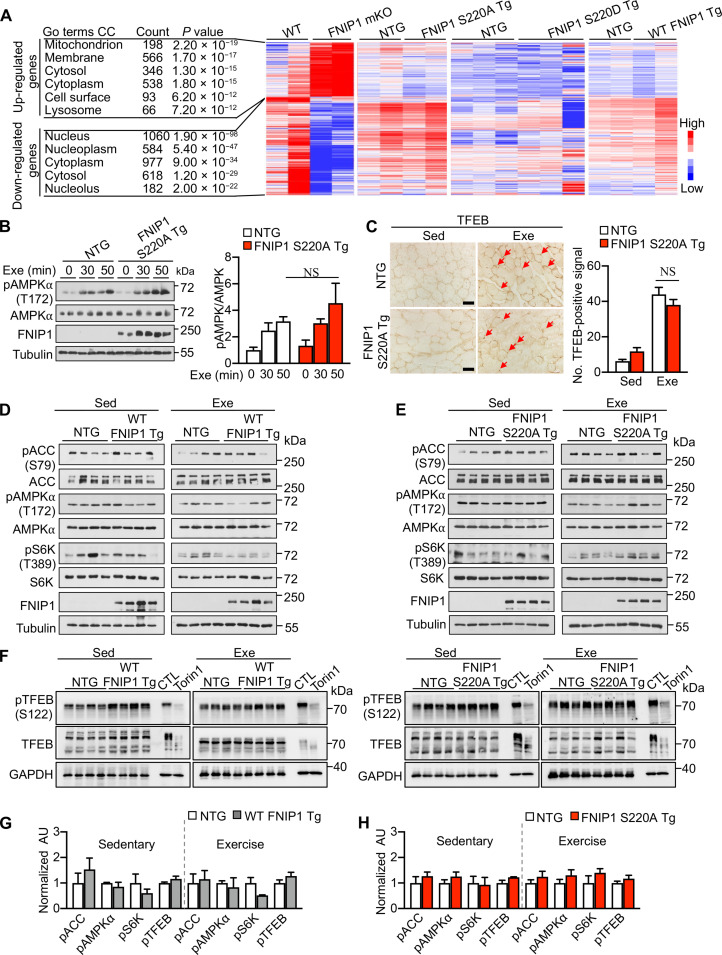
Fig. 4. FNIP1 (S220) phosphorylation regulates muscle mitochondrial function without affecting TFEB signaling.
(A) Gene expression profiling of GC muscle in mice. Heatmap analysis of DEGs in muscles of WT, FNIP1 mKO, and different transgenic (Tg) mice compared with NTG controls (n = 2 to 3 biological samples per group). DEGs between different groups were analyzed by Gene Ontology (GO), and mRNA fold change is indicated by colored bar. (B) Left: Representative immunoblots of muscle protein extracts from indicated mice following acute running exercise (Exe). Right: Quantification of AMPKα (T172) phosphorylation by pAMPK/AMPK signal ratios. n = 4 mice per group. (C) Left: Representative cross-sectional images of plantaris muscle stained with anti-TFEB antibody from indicated mice with or without exercise (Sed or Exe). Scale bars, 50 μm. Right: Quantification of TFEB-positive nuclear localization. n = 3 mice per group. (D and E) mTORC1 and AMPK signaling in Fnip1 Tg muscle. Immunoblotting analysis of WV muscle lysates from sedentary (Sed) and 60-min exercised (Exe) mice of indicated genotype. n = 4 mice per group. (F) TFEB phosphorylation analysis in Fnip1 Tg muscle. Immunoblotting analysis of muscle lysates from sedentary and 60-min exercised mice of indicated genotype. To monitor the band shift of TFEB, lysates of HEK293T cells with or without Torin1 treatment (CTL) were loaded as controls. (G to H) Quantification of pACC (S79), pAMPKα (T172), pS6K (T389), and pTFEB (S122), phosphorylation by signal ratios normalized to NTG controls (=1.0) during sedentary or exercise conditions from (D) to (F). n = 4 to 8 mice per group. Error bars are shown as the means ± SEM. NS, P > 0.05 was determined by one-way ANOVA coupled to Fisher’s LSD post hoc test [(B) and (C)]. No statistical significance in (G) and (H) calculated by Student’s t test.

