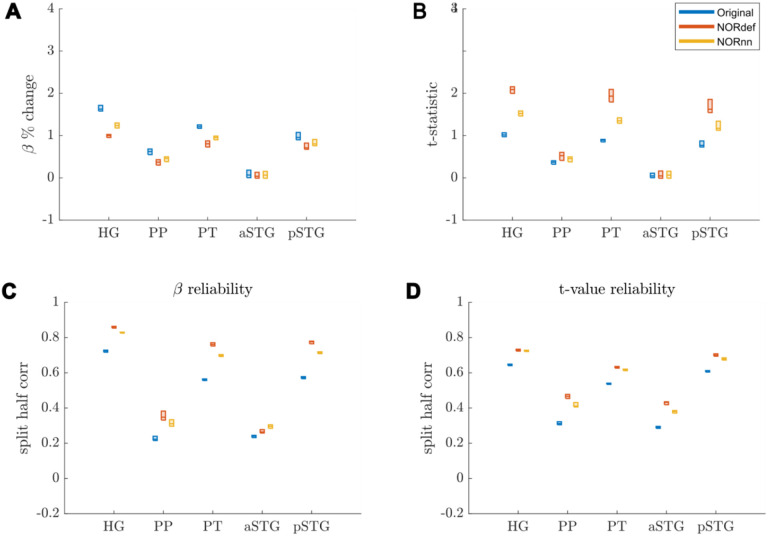
Figure 6. Responses in gray matter confined to regions of interest.
A) Beta values calculated in percent signal change. In each ROI where there is signal present in the Original dataset, we observed a reduction in beta values after denoising. This reduction was lower in NORnn. B) T-statistics are increased after denoising, which was most pronounced in the NORdef dataset. C) Split half correlations were calculated to estimate the stability of beta responses. This revealed that beta values are more stably estimated after denoising. D) T-values are more reliably estimated in NORDIC.

