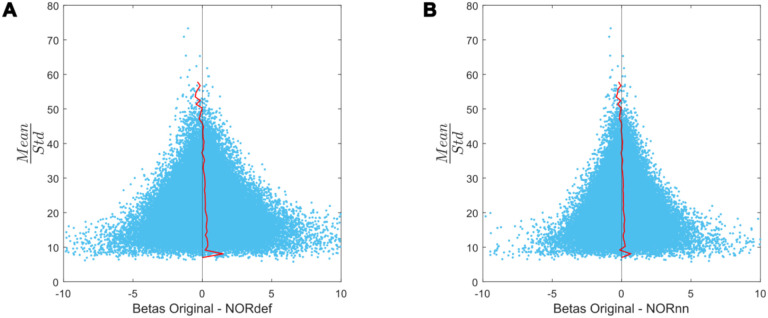
Figure 7. Beta difference in relation to tSNR for one representative subject.
A) Betas before and after NORDIC are displayed as a function of mean/standard deviation (tSNRpr). For low tSNRpr values, the betas change in both directions. However, at high tSNRpr, the betas remain relatively similar after NORDIC. The red line indicates the mean beta difference per bin. The black line indicates a beta difference of zero. B) Same as A but for the beta difference between Original minus NORnn betas.

