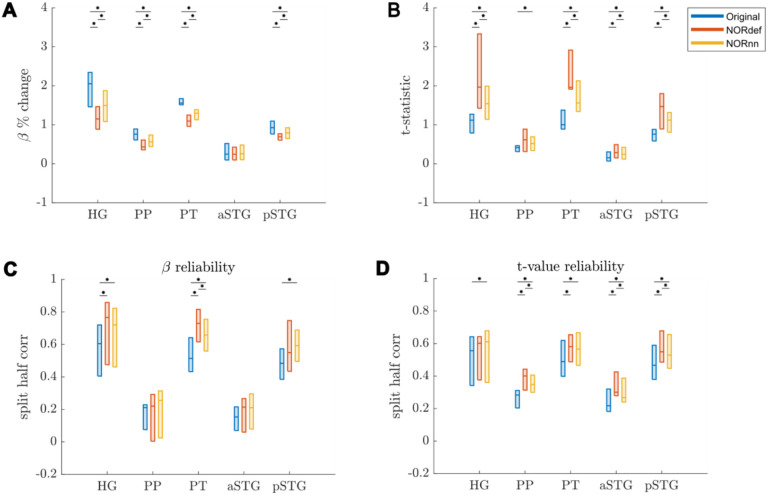
Figure 8. Group Figure of beta- and t-value estimates.
A) Average reduction of beta values across participants. B) At the group level, the increase in t-values remains. C) On average, denoising results in a better estimate of beta values calculated with split half correlations in ROIs where there is more signal in the data. D) t-value reliability is generally higher after NORDIC than in the Original data. * indicates p<0.05.

