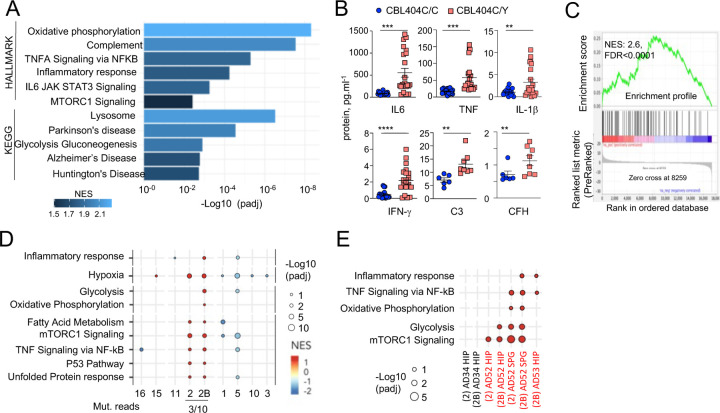
Fig. 5-. CBL404C/Y microglia signature.
(A) HALLMARK and KEGG pathways (FDR /adj.p value <0.25, selected from Supplementary Table 8) enriched in gene set enrichment analysis (GSEA) of RNAseq from from CBL404C/Y iPSC-derived macrophages and isogenic controls NES, normalized enrichment score. (B) ELISA for pro-inflammatory cytokines (n=3) and complement proteins (n=2) in the supernatant from CBL404C/Y iPSC-derived microglial like cells and isogenic controls. Statistics: p-value are obtained by nonparametric Mann-Whitney U test,* 0.05, ** 0.01, *** 0.001, **** 0.0001. (C) GSEA analysis for enrichment of the human AD-microglia snRNAseq signature (MIC1) 21 in differentially expressed genes between CBL404Y/C microglial like cells and isogenic controls. (D) Dot plot represents the GSEA analysis of HALLMARK and KEGG pathways enriched in snRNAseq microglia clusters (samples from all donors). Genes are pre-ranked per cluster using differential expression analysis with SCANPY and the Wilcoxon rank-sum method. Statistical analyses were performed using the fgseaMultilevel function in fgsea R package for HALLMARK and KEGG pathways. Selected gene-sets with p-value < 0.05 and adjusted p-value < 0.25 are visualized using ggpubr and ggplot2 R package (gene sets/pathways are selected from Supplementary Fig. 6B, Supplementary Table 9). (E) Dot plot represents the GSEA analysis (as in (E)) of HALLMARK and KEGG pathways enriched in cluster 2 / 2B and deconvoluted by donor samples (selected from Supplementary Fig. 6A).

