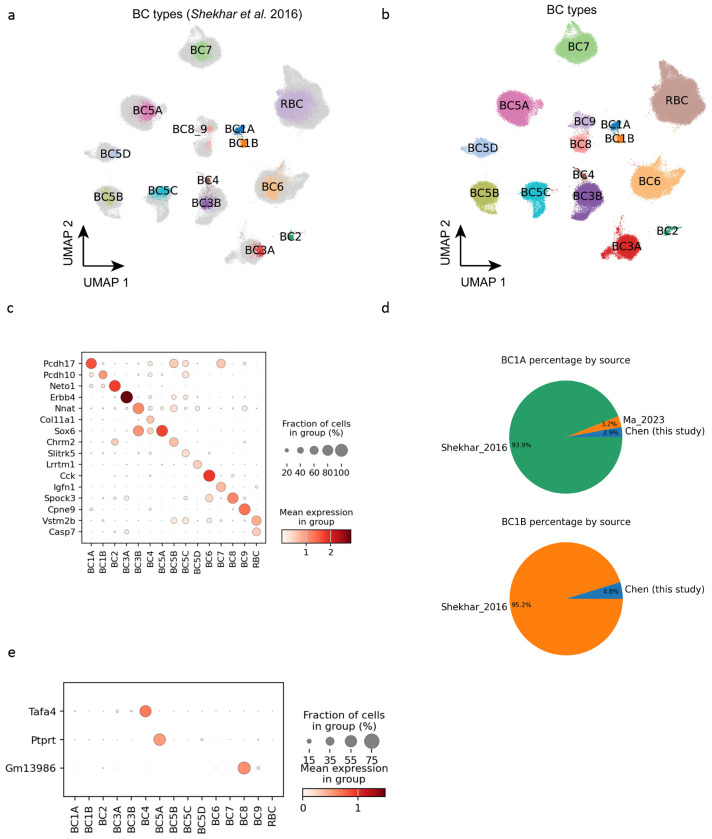
Figure 2. Bipolar cells.
(a) UMAP visualization of BCs colored by public cell type labels from Shekhar et al. 2016. The newly discovered cells without public labeling are colored in gray. (b) BCs colored by the 15 annotated annotated cell types. (c) Dot plot of BC type marker gene expression in the 15 types. (d) Pie chart showing the percentage each data source making up BC1A and BC1B population. (e) Dot plot of new markers for three BC types: BC4, BC5A, and BC8. The three new markers exhibit more exclusive expression patterns.

