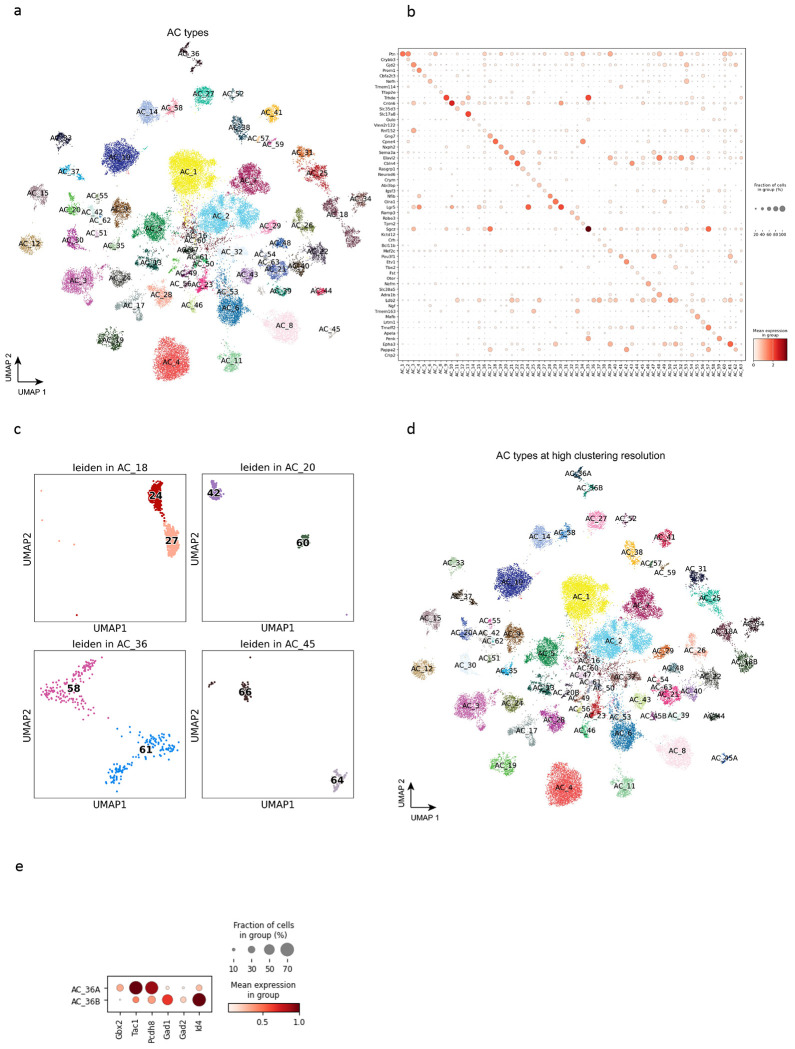
Figure 3. Amacrine cells.
(a) UMAP visualization of AC cells colored by the annotated types. (b) Dot plot of canonical marker gene expression in AC types. (c) Four previously under-clustered AC types, i.e., AC18, AC20, AC36, and AC45, are split into two distinct clusters at a high resolution of clustering. (d) Visualization of AC cells colored by AC types at a high clustering resolution. (e) Dot plot of DEGs expressed in two split clusters for AC_36, stratifying Gbx2+ AC types in AC_36.

