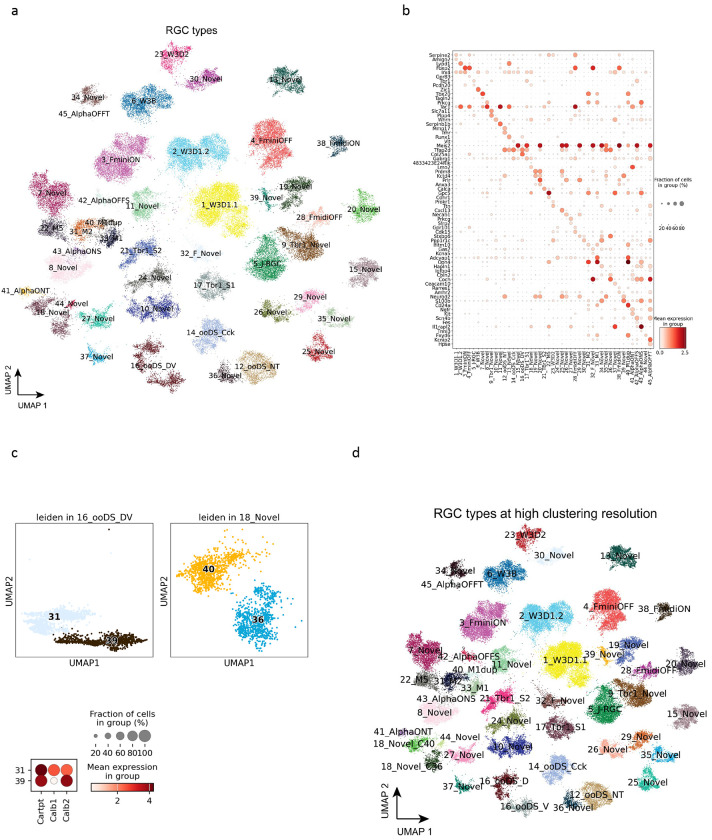
Figure 4. Retinal ganglion cells.
(a) UMAP visualization of RGC cells colored by the annotated types. (b) Dot plot of canonical marker gene expression in RGC types. (c) Two previously under-clustered RGC types, i.e., 16_ooDS_DV and 18_Novel, are split into two distinct clusters at a high resolution of clustering. Dot plot of Calb1 and Calb2 in the two split clusters of 16_ooDS_DV. (d) Visualization of RGC cells colored by RGC types at a high clustering resolution.

