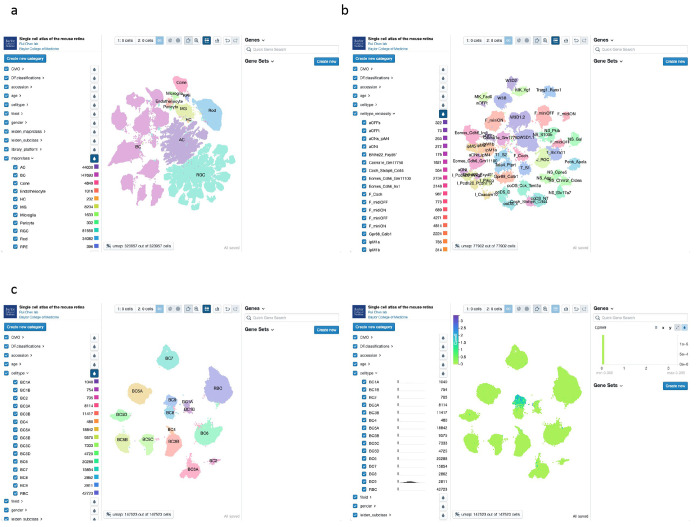
Figure 5. Visualization of MRCA in accessible interactive browsers.
(a) Visualization of the MRCA in the CELLxGENE browser. The homepage depicts three panels to explore the MRCA. The left panel contains the pre-computed features facilitating the selection of cells by interested categories. The middle panel is the UMAP of the MRCA, colored by the annotated major classes. The right panel allows input of quick gene symbols and gene sets. (b) Visualization of the subclass RGC atlas in the CELLxGENE browser. The middle panel depicts RGCs colored by the reclassified names selected in the left panel. (c) Visualization of gene expression for a BC9 marker, Cpne9, in the BC atlas. The left subfigure shows the BC types, and the right subfigure highlights the normalized gene expression values of Cpne9 for BC9 type in the middle panel.

