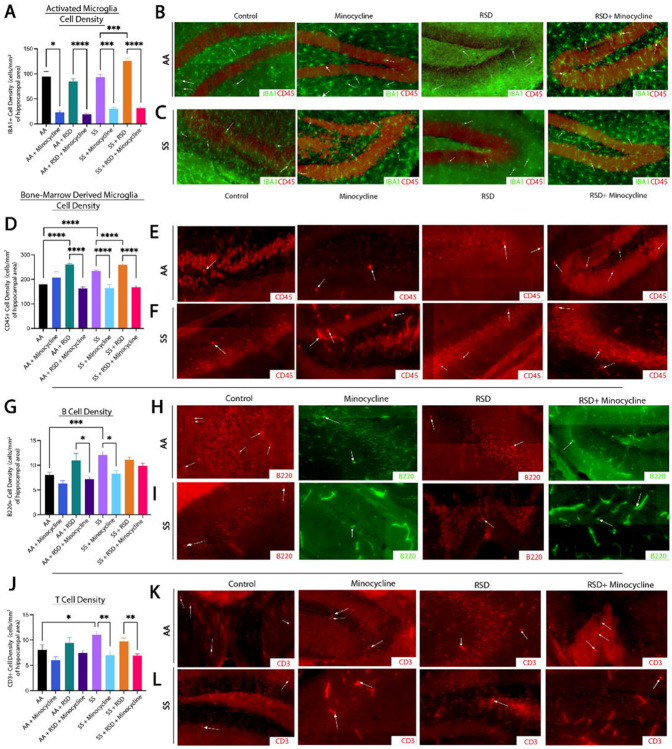
Figure 2.
Sickle cell mice exposed to RSD have higher density of activated microglia and B, and T cell infiltrate in the hippocampus while minocycline reduces the density of immune cell infiltrate. A) IBA-1+ activated microglia cell density. B) Representative immunohistochemistry images of IBA-1+ activated microglia in AA control mice, AA mice treated with minocycline, AA mice exposed to RSD, and AA mice exposed to RSD and treated with minocycline. C) Representative immunohistochemistry images of IBA-1+ activated microglia in SS control mice, SS mice treated with minocycline, SS mice exposed to RSD, and SS mice exposed to RSD and treated with minocycline. D) CD45+ bone-marrow derived microglia cell density. E) Representative immunohistochemistry images of CD45+ bone-marrow microglia in AA control mice, AA mice treated with minocycline, AA mice exposed to RSD, and AA mice exposed to RSD and treated with minocycline. F) Representative immunohistochemistry images of CD45+ bone-marrow microglia in SS control mice, SS mice treated with minocycline, SS mice exposed to RSD, and SS mice exposed to RSD and treated with minocycline. G) B220+ B cell density. H) Representative immunohistochemistry images of B220+ B cells in AA control mice, AA mice treated with minocycline, AA mice exposed to RSD, and AA mice exposed to RSD and treated with minocycline. I) Representative immunohistochemistry images of B220+ B cells in SS control mice, SS mice treated with minocycline, SS mice exposed to RSD, and SS mice exposed to RSD and treated with minocycline. J) CD3+ T cell density. K) Representative immunohistochemistry images of CD3+ T cells in AA control mice, AA mice treated with minocycline, AA mice exposed to RSD, and AA mice exposed to RSD and treated with minocycline. L) Representative immunohistochemistry images of CD3+ T cells in SS control mice, SS mice treated with minocycline, SS mice exposed to RSD, and SS mice exposed to RSD and treated with minocycline. Cell density was compared between groups with a one-way ANOVA and Fisher’s LSD multiple comparisons test. *p<0.05, **p<0.01, ***p<0.001. Data are presented as mean ± SD.

