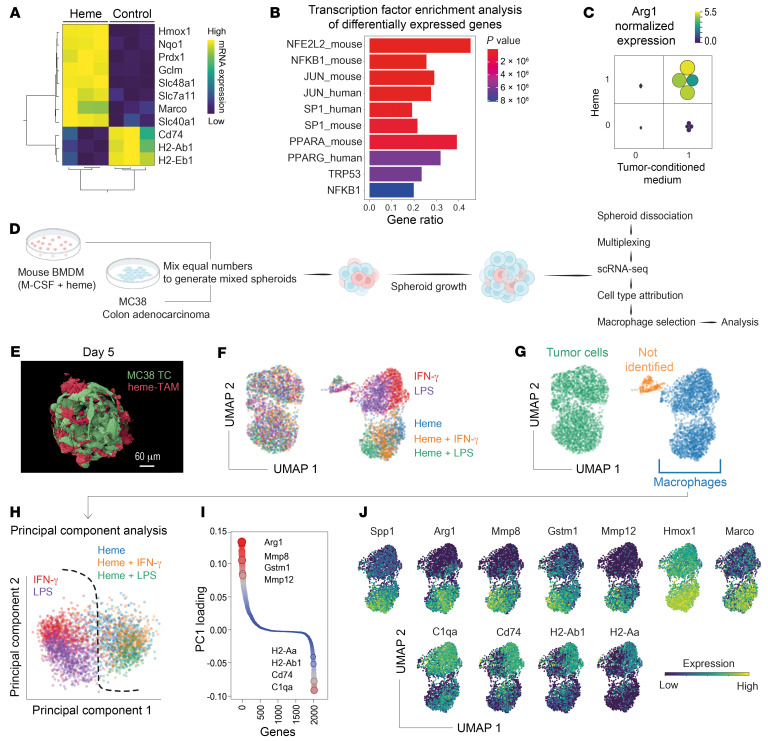
Figure 4. Heme-TAMs in 3D spheroid cancer cell cultures.
(A) Expression heatmap and unsupervised hierarchical clustering analysis of marker genes quantified by bulk RNA-Seq in control and heme-treated BMDMs cultured in 2D (normalized log2 counts). Each column represents macrophages from 1 mouse (n = 3). (B) EnrichR analysis of all significantly differentially expressed genes (log2[fold change] 0.5, P 0.001, n = 3). The gene ratio defines the overlap of the input genes and the term-associated genes, and the top 10 enriched terms are shown. Terms are ranked by their P value. (C) Results of a factorial experiment defining the synergistic effect of heme and MC38 cell culture supernatant on Arg1 mRNA expression in 2D BMDM cultures. Arg1 expression was measured by RT-qPCR. Color and size of the dots represent the normalized gene expression per sample (n = 4 BMDM cultures per condition). (D) Experimental workflow used to generate and analyze mixed-cell-type 3D spheroids containing MC38 tumor cells and BMDMs. (E) 3D reconstruction of a confocal microscopy image stack of a mixed-cell-type spheroid resulting from a 5-day culture of GFP-MC38 cells (green) and heme-TAM-tomato cells (red) in a microwell plate. Scale bar: 60 μm. (F) Results of a multiplexed scRNA-Seq experiment with mixed-cell-type spheroids containing MC38 cells and BMDMs that had been pretreated with heme, LPS, IFN-γ, or combinations thereof. The spheroids were collected for scRNA-Seq 24 hours after the 2 cell types were mixed and seeded on microwell plates. The UMAP is color-coded to indicate the BMDM pretreatment. (G) Cell-type assignment of the spheroid cells was performed, and macrophages were extracted for further analysis. (H) In PCA of spheroid macrophages, PC1 segregates the heme-pretreated BMDMs from those not pretreated with heme. (I) The contribution of individual genes to PC1 is expressed as loadings. Genes are ordered and color-coded by their PC1 loading. A high absolute value indicates that the gene strongly influences overall gene expression variance. The highest PC1 loading was found for Arg1. (J) Expression heatmaps of the top PCA drivers and selected heme-induced TAM marker genes.

