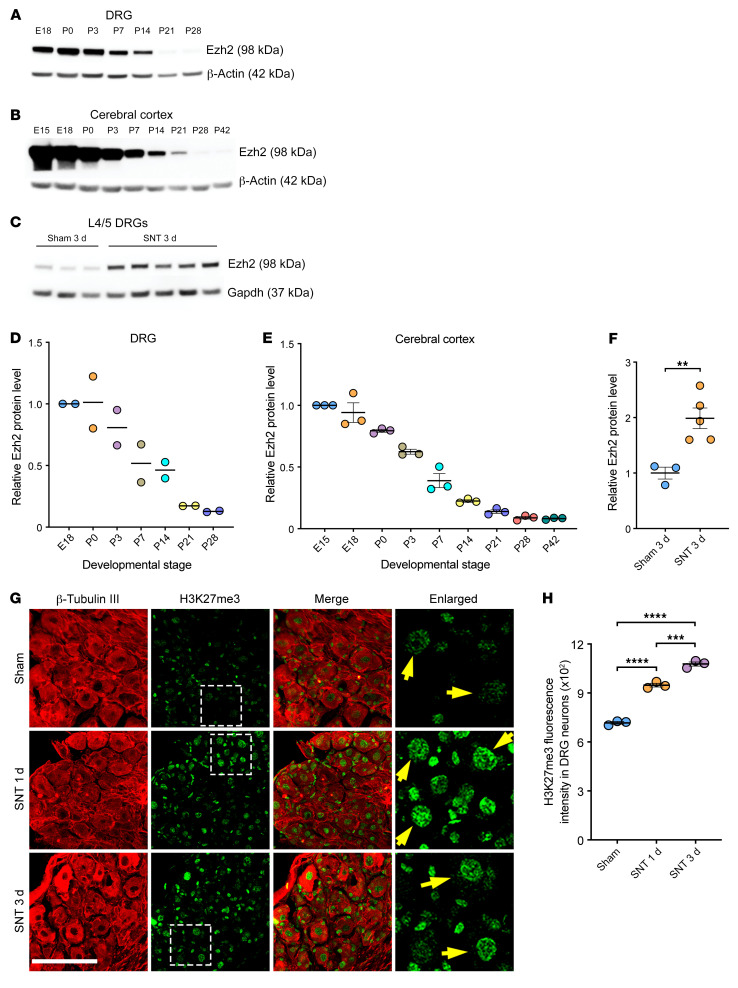
Figure 1. Ezh2 is developmentally downregulated in the nervous system and upregulated in DRG neurons following peripheral nerve injury.
(A and B) Representative immunoblotting showing that Ezh2 is developmentally downregulated in the DRG (A) and cerebral cortex (B). (C) Immunoblotting showing that Ezh2 is significantly increased in L4/5 DRGs 3 days after sciatic nerve transection. (D) Quantification of relative protein levels of Ezh2 in A (n = 2 independent experiments). (E) Quantification of relative protein levels of Ezh2 in B (1-way ANOVA followed by Tukey’s multiple comparisons; P 0.0001; n = 3 independent experiments). (F) Quantification of relative protein levels of Ezh2 in C (unpaired, 2-tailed t test; P = 0.0092; n = 3 for sham, n = 5 for sciatic nerve transection). (G) Representative immunofluorescence of DRG sections showing increased H3K27me3 levels in nuclei of DRG neurons 1 or 3 days after sciatic nerve transection. DRG sections were stained with anti-H3K27me3 (green) and anti-β-tubulin III (red). The rightmost column displays enlarged images of the areas outlined in white, dashed boxes. Yellow arrows indicate H3K27me3 in nuclei of DRG neurons. Scale bars: 100 μm, 30 μm for enlarged images. (H) Quantification of fluorescence intensity of H3K27me3 immunoreactivity in DRG neurons in G (1-way ANOVA followed by Tukey’s multiple comparisons; P 0.0001; n = 3 mice for all). SNT, sciatic nerve transection. **P 0.01, ***P 0.001, ****P 0.0001.

