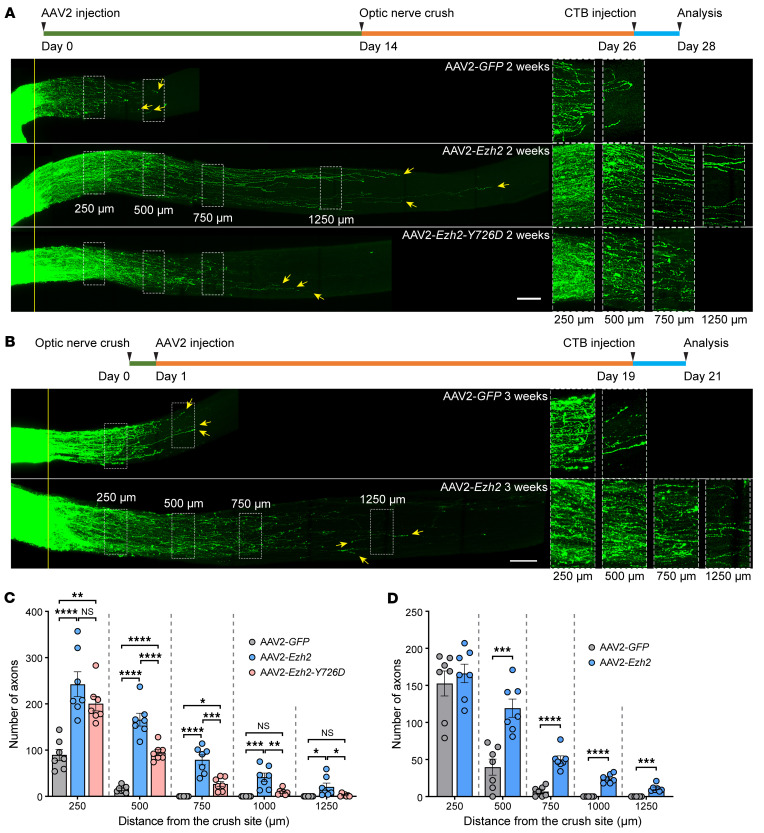
Figure 4. Ezh2 overexpression enhances optic nerve regeneration via both histone methylation-dependent and -independent mechanisms.
(A and B) Top: Experimental timeline. Bottom: Representative images of optic nerves showing that pre- (A) or postinjury (B) overexpression of Ezh2 induces strong optic nerve regeneration 2 (A) or 3 weeks (B) after optic nerve crush. Preinjury overexpression of Ezh2-Y726D also modestly promotes optic nerve regeneration (A). Columns on the right display enlarged images of the areas in the white, dashed boxes on the left, showing axons at 250, 500, 750, and 1,250 μm distal to the crush sites, which are aligned with the yellow line. Yellow arrows indicate longest axons in each nerve. Scale bars: 100 μm, 50 μm for enlarged images. (C) Quantification of optic nerve regeneration in A (1-way ANOVA followed by Tukey’s multiple comparisons; P 0.0001 at 250, 500, 750, and 1,000 μm, P = 0.0126 at 1,250 μm; n = 7 mice for all). (D) Quantification of optic nerve regeneration in B (unpaired 2-tailed t test; P = 0.5305 at 250 μm, P = 0.0004 at 500 μm, P 0.0001 at 750 and 1,000 μm, P = 0.0003 at 1,250 μm; n = 7 mice for both). *P 0.05, **P 0.01, ***P 0.001, ****P 0.0001.

