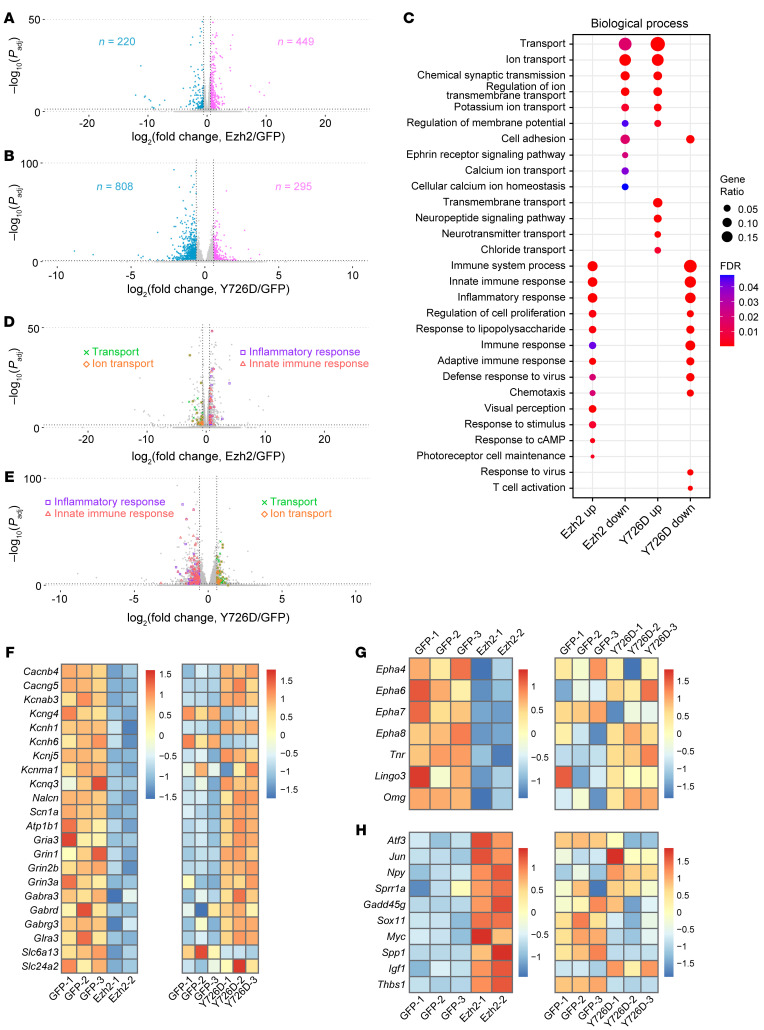
Figure 5. Ezh2 modifies the RGC transcriptome to regulate multiple categories of target genes.
(A and B) Volcano plots showing differences in gene expression between control and Ezh2 overexpression conditions (A) or between control and Ezh2-Y726D overexpression conditions (B). Note that 12 genes with –log10 (Padj) 50 and 3 genes with –log10(Padj) 100 are not plotted in A and B, respectively. (C) GO analysis of DEGs induced by Ezh2 or Ezh2-Y726D overexpression. A subset of most significantly enriched GO terms in the biological process category are shown here. (D and E) Volcano plots described in A and B with DEGs in 4 enriched GO terms labeled. (F and G) Heatmaps of mRNA levels of neuronal excitability and synaptic transmission regulators (F) and axon regeneration inhibitory factors (G) downregulated by Ezh2 overexpression in the control versus Ezh2 overexpression RNA-Seq (left) and the control versus Ezh2-Y726D overexpression RNA-Seq (right). (H) Heatmaps of mRNA levels of axon regeneration positive regulators upregulated by Ezh2 overexpression in the control versus Ezh2 overexpression RNA-Seq (left) and the control versus Ezh2-Y726D overexpression RNA-Seq (right). Note that the control versus. Ezh2 overexpression RNA-Seq and the control versus Ezh2-Y726D overexpression RNA-Seq were performed separately. Therefore, control (GFP) libraries in one RNA-Seq are independent of those in the other.

