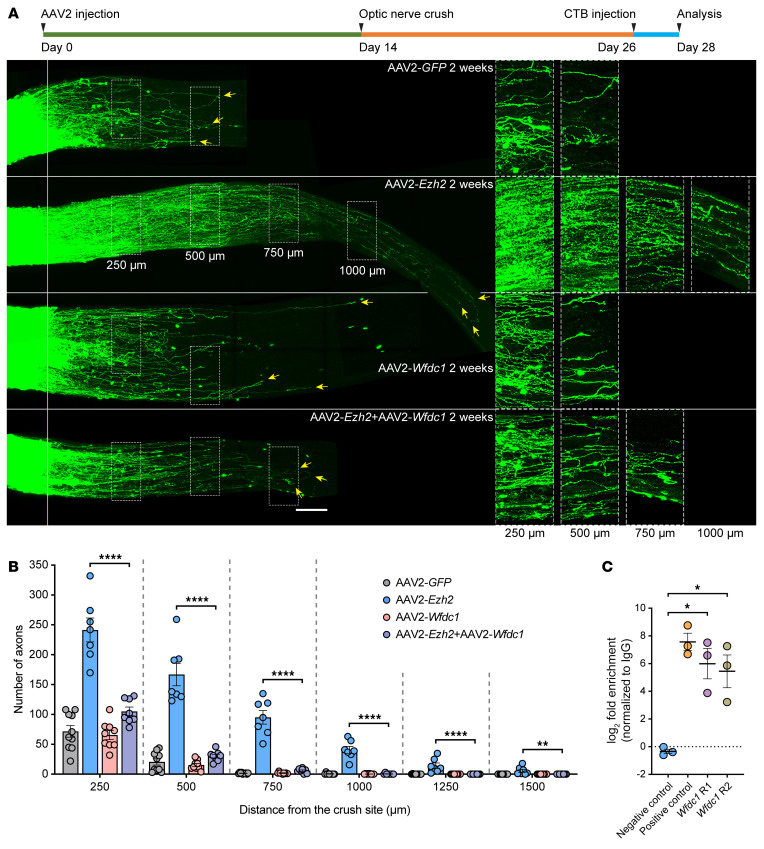
Figure 9. Ezh2 overexpression enhances optic nerve regeneration by transcriptionally suppressing Wfdc1.
(A) Top: Experimental timeline. Bottom: Representative images of optic nerves showing that Wfdc1 overexpression completely blocks Ezh2 overexpression–induced optic nerve regeneration. Columns on the right display enlarged images of the areas in the white, dashed boxes on the left, showing axons at 250, 500, 750, and 1,000 μm distal to the crush sites, which are aligned with the yellow line. Yellow arrows indicate longest axons in each nerve. Scale bars: 100 μm, 50 μm for enlarged images. (B) Quantification of optic nerve regeneration in A (1-way ANOVA followed by Tukey’s multiple comparisons; P 0.0001 at 250, 500, 750, 1,000, and 1,250 μm, P = 0.0015 at 1,500 μm; n = 10 mice for control, n = 7 mice for Ezh2 overexpression, n = 9 mice for Wfdc1 overexpression, n = 8 mice for Ezh2 and Wfdc1 cooverexpression). Note that the control and Ezh2 overexpression conditions are identical to those in Figure 8B. (C) CUTTag followed by qPCR showing H3K27me3 enrichment in the promoter region of Wfdc1 (paired 2-tailed t test; P = 0.0357 between negative control and Wfdc1 R1, P = 0.0478 between negative control and Wfdc1 R2; n = 3 independent experiments). Note that the negative control and positive control are identical to those in Figure 6A. *P 0.05, **P 0.01, ***P 0.001, ****P 0.0001.

