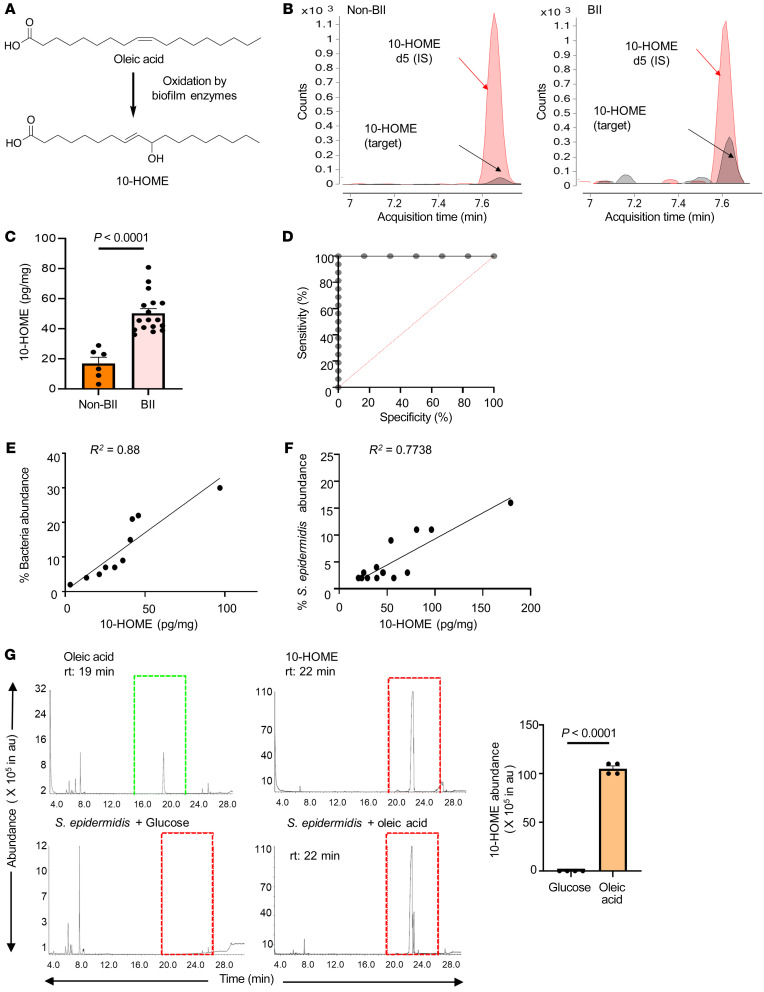
Figure 2. Increased abundance of biofilm-derived 10-HOME in participants with BII.
(A) Schematic of formation of 10-HOME from oleic acid. (B–D). Increased abundance of 10-HOME in implant-associated tissue of participants with BII. (B) Chromatograms of 10-HOME from non-BII and BII tissues using LC-MS/MS targeted analyses. (C) Data presented as mean ± SEM, n = 6 (non-BII), n = 17 (BII), t test was used to determine BII versus non-BII (P < 0.0001). (D) Receiver operating characteristic (ROC) curve analysis to determine specificity and sensitivity of 10-HOME detection. (E) Increased abundance of bacteria associated with 10-HOME detected from the implant-associated tissue of participants with BII. (F) Increased abundance of Staphylococcus epidermidis associated with 10-HOME detected from the implant-associated tissue of participants with BII. (G) Synthesis of 10-HOME by S. epidermidis in vitro upon using oleic acid as carbon source. Gas chromatography-mass spectrometry analyses for detection of 10-HOME derivatized both as trimethylsilyl ethers and methyl estersoleic acid standard, 10-HOME standard, S. epidermidis with glucose as carbon source, S. epidermidis with oleic acid as carbon source, quantification of 10-HOME abundance. n = 4. t test was used to determine glucose versus oleic acid (P < 0.0001).

