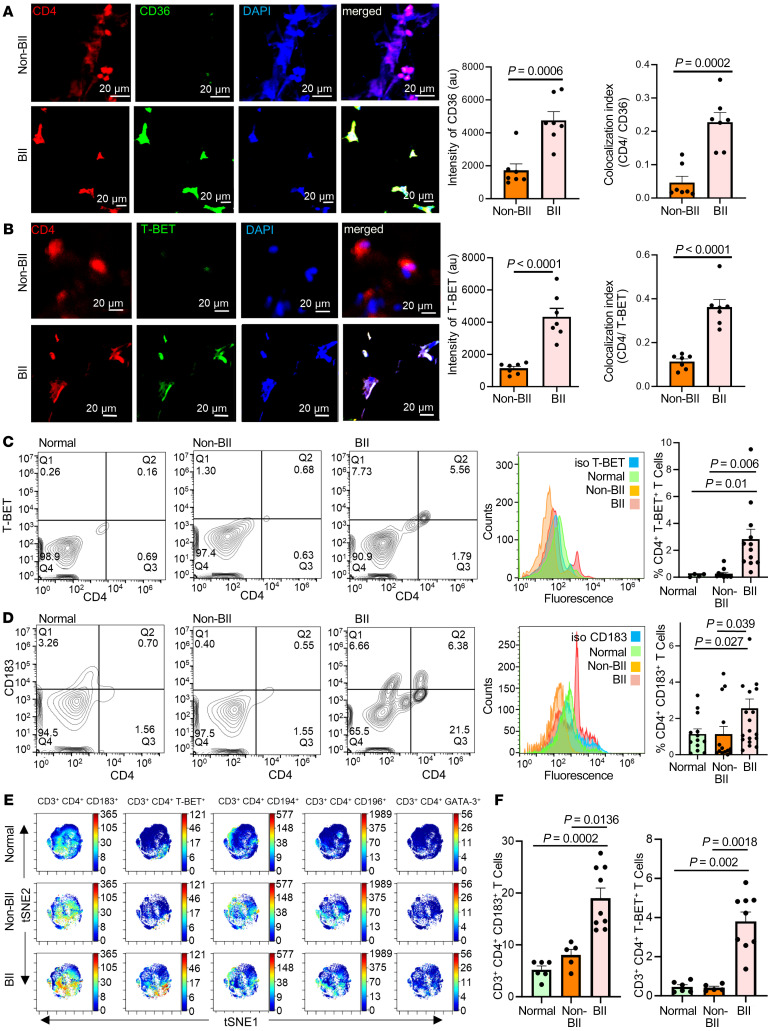
Figure 4. Abundance of CD4+ Th1 cells in implant-associated tissue of participants with BII.
(A) Increased expression of CD36 in breast tissue associated with participants with BII, immunostained with anti-CD4 (red), anti-CD36 (green), and DAPI (blue). Data presented as mean ± SEM, (n = 7). Scale bar: 20 μm. A t test was used to determine BII versus non-BII intensity (P = 0.0006), colocalization (P = 0.0002). (B) Increased expression of T-BET in breast tissue associated with participants with BII, immunostained with anti-CD4 (red), anti-T-BET (green), and DAPI (blue). Data presented as mean ± SEM, (n = 7). Scale bar: 20 μm. A t test was used to determine BII versus non-BII Intensity (P < 0.0001) and colocalization (P < 0.0001). (C) Flow cytometry with anti-CD4 (FITC) and anti-TBET (PE). Representative plots: normal, BII, histogram with isotype control for T-BET. Data presented as mean ± SEM, n = 4 (normal), n = 11 (non-BII), and n = 12 (BII). Bivariate Kruskal-Wallis with posthoc Benjamini-Hochberg adjusted pairwise comparison analysis was used to compare BII versus normal (P = 0.01) and BII versus non-BII (P = 0.006). (D) Elevated Th1 subtype in the peripheral blood of participants with BII. Flow cytometry analyses peripheral blood of participants stained with anti-CD4 (FITC) and anti-CD183 (PE). Representative flow plots: normal, non-BII, BII, histogram with isotype control for CD183. Data presented as mean ± SEM, n = 13 (normal), n = 14 (non-BII), n = 20 (BII). Bivariate Kruskal-Wallis with posthoc Benjamini-Hochberg adjusted pairwise comparison analysis was used to determine BII versus normal (P = 0.027) and BII versus non-BII (P = 0.039). (E) Representative viSNE plots for CD3+ CD4+ T cells. Color depicts the intensity of the marker labeled on arcsinh scales from blue (low) to red (high). The analyses indicated elevated Th1 subtype in the peripheral blood of participants with BII. (F) Quantification of median marker expression using CytoBank software for panel E, CD183 and T-BET, n = 6 (normal), n = 5 (non-BII), and n = 9 (BII). Bivariate Kruskal-Wallis with posthoc Benjamini-Hochberg adjusted pairwise comparison analysis were used for analyses. For CD183, BII versus normal (P = 0.0002); BII versus non-BII (P = 0.0136); for T-BET, BII versus normal (P = 0.002); BII versus non-BII (P = 0.0018). The quantification of the remainder of viSNE plots is in Supplemental Figure 15.

