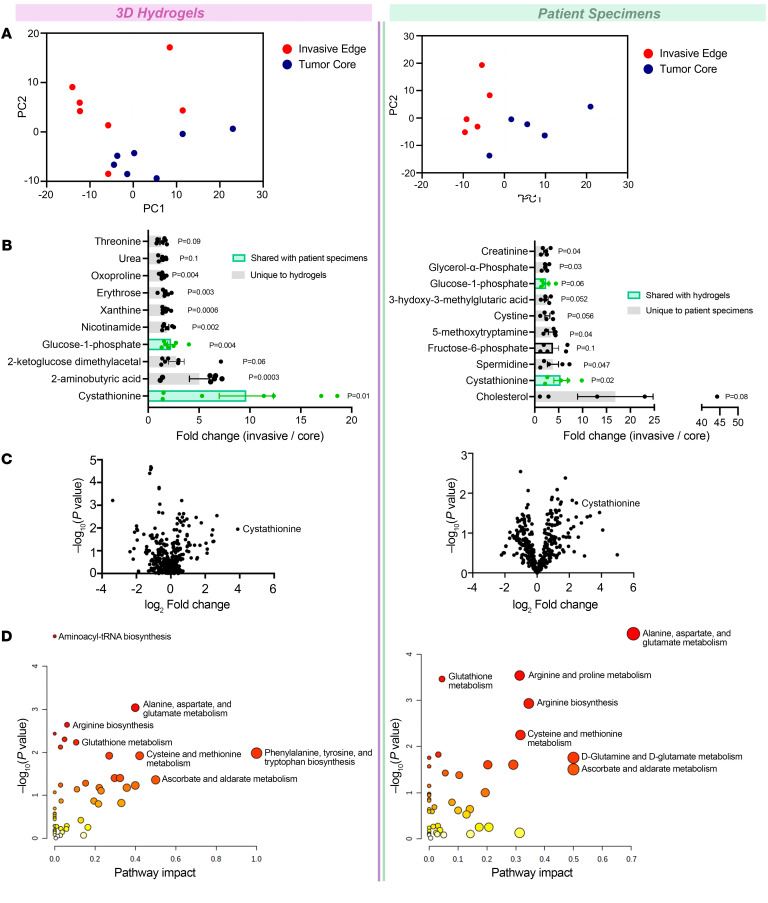
Figure 1. Invasive GBM cells display a distinct metabolic profile in which cystathionine and other oxidative stress metabolites are upregulated.
Shown are results from metabolomic analysis of cells from the invasive front and tumor core of GBM43 cells in 3D hydrogels (left) and site-directed biopsies (right) of patient GBMs. (A) PCAs from hydrogels (left, n = 7/group) and site-directed patient biopsies (right, n = 5/group). (B) Bar graphs displaying 10 most enriched metabolites by t test at the invasive tumor front versus core of hydrogels (left) and patient tumors (right). (C) Volcano plots displaying fold change for metabolites in the invasive front of hydrogels (left) and patient tumors (right) compared with the tumor core. (D) MetaboAnalyst identified pathways upregulated at the invasive tumor front of hydrogels (left) and patient GBMs (right). Pathways are plotted according to significance (y axis) and pathway impact value (x axis). Node color is based on P value (darker colors = more significance), and node radius is based on pathway impact values (larger circles = greater pathway enrichment). Most contributing pathways are in the top right corner.

