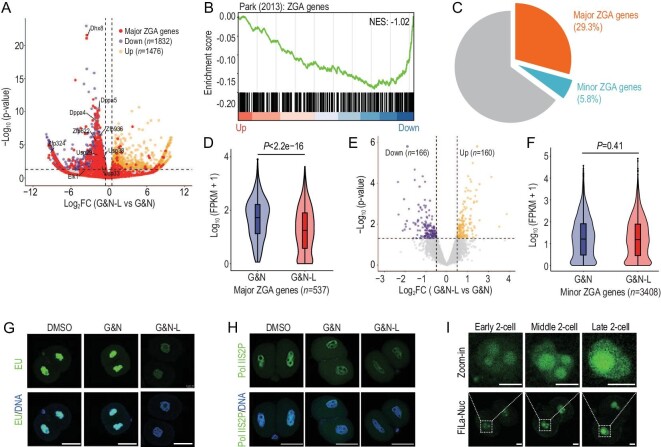
Figure 2.
Loss of lactate results in failure of major ZGA in early embryos of mice. (A) RNA-seq analysis of late 2-cell embryos from the G&N and G&N-L groups. Volcano plot showing changes in gene expression. Yellow and purple dots indicate upregulated and downregulated genes, and red dots indicate major ZGA genes. (B) Gene set enrichment analysis (GSEA) of ZGA genes shows preferential downregulation in late 2-cell embryos from the G&N-L group. (C) Fractions of minor ZGA, major ZGA, and other coding genes among the downregulated genes in (A). (D) Violin plot showing the significant downregulation of major ZGA genes in the G&N-L group. (E) RNA-seq analysis of early 2-cell embryos from the G&N and G&N-L groups. Volcano plot showing changes in gene expression. Yellow and purple dots indicate upregulated and downregulated genes. (F) Violin plot showing that the expressions of minor ZGA genes had no significant change between the G&N and G&N-L groups. (G) 5ʹ-Ethynyluridine (EU) staining showing a remarkable decrease in total de novo transcripts in late 2-cell embryos of the G&N-L group. Scale bars, 50 μm. (H) IF of Pol II Ser2 of late 2-cell embryos showing a remarkable decrease in the G&N-L group. Scale bars, 50 μm. DMSO, mKSOM culture medium plus DMSO; G&N, mKSOM culture medium plus Gne140 and NMN; G&N-L, mKSOM culture medium without lactate plus Gne140 and NMN. (I) Fluorescence images of mouse 2-cell embryos expressing FiLa in the nucleus. Scale bars, 20 μm. Differences between means were calculated using two-tailed Student's t-test.

