Figure 3.
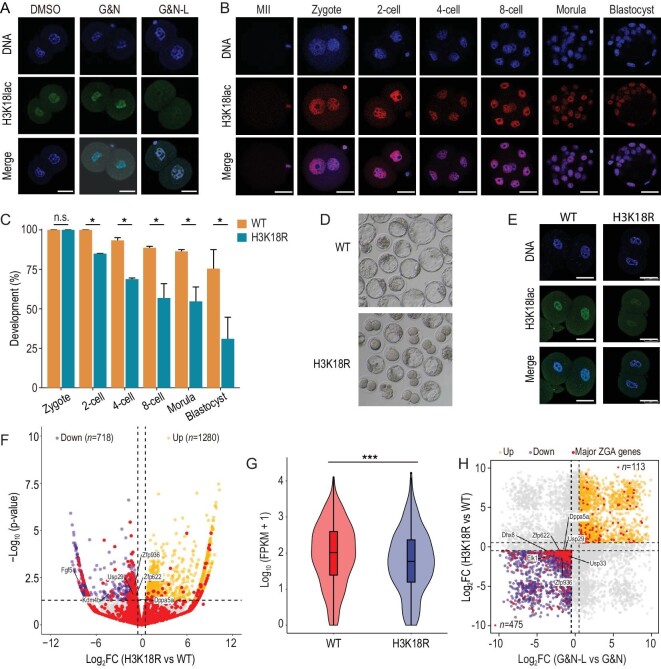
H3K18lac is reduced by deprivation of lactate and affects major ZGA. (A) IF of late 2-cell embryos shows that H3K18lac is remarkably decreased in the G&N-L compared to the other groups. DMSO, mKSOM culture medium plus DMSO; G&N, mKSOM culture medium plus Gne140 and NMN; G&N-L, mKSOM culture medium without lactate plus Gne140 and NMN. Scale bars, 50 μm. (B) IF of H3K18lac during the development of preimplantation embryos developing in vivo in mice. Representative images are shown. Scale bars, 50 μm. (C and D) Development rates of embryos with overexpressions of wide type (WT) and mutated H3 mRNAs (H3K18R). Error bars are SEM. n.s. means not significant. *P < 0.05. (E) IF of late 2-cell embryos showing that H3K18lac is decreased by overexpressing H3K18R mRNAs. Scale bars, 50 μm. (F) RNA-seq analysis of late 2-cell embryos with overexpressions of wide type (WT) and mutated H3 mRNAs (H3K18R). Volcano plot shows changes in gene expression. Yellow and purple dots indicate upregulated and downregulated genes, and red dots indicate major ZGA genes. (G) Violin plot showing the significant downregulation of major ZGA genes in the H3K18R mRNAs-overexpressed group. ***P < 0.001. (H) Comparative analysis of the RNA-seq data of the lactate-deprived and H3K18R-mutated embryo. Yellow and purple dots indicate commonly upregulated and downregulated genes, respectively. Red dots represent the major ZGA genes. Differences between means were calculated using two-tailed Student's t-test.

