Figure 5.
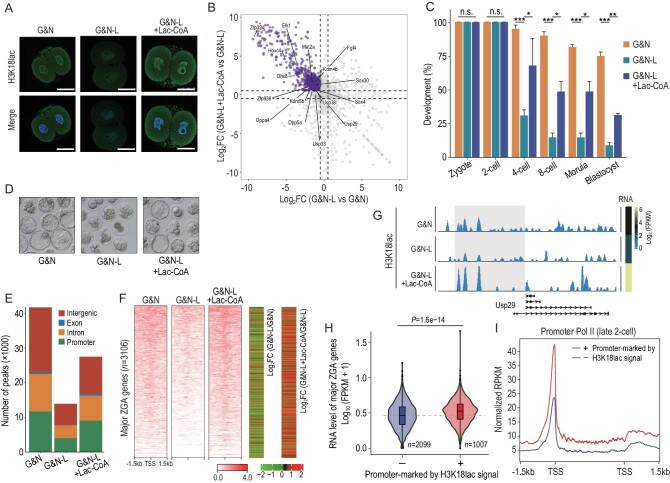
Lac-CoA can rescue the abnormal phenotypes caused by deprivation of lactate. (A) IF of H3K18lac in late 2-cell embryos from the groups indicated. Scale bars, 50 μm. (B) RNA-seq analysis showing the expressions of major ZGA genes rescued by the addition of 1 mM Lac-CoA. Purple dots indicate the rescued major ZGA genes. (C and D) Development rates of embryos from the groups indicated. Three experimental replicates were performed. Error bars are SEM. n.s. means not significant. *P < 0.05; **P < 0.01; ***P < 0.001. (E) Fraction of the mouse genome covered by H3K18lac reads in the groups indicated, and percentages of H3K18lac peaks assigned to the promoter, intron, exon, and intergenic regions. (F) Heatmap (left panel) of H3K18lac signals ranked by their relative changes among the groups indicated. Heatmap (right panel) showing the expression changes of major ZGA genes between the groups indicated. (G) Genome browser view of H3K18lac signals at the Usp29 locus of late 2-cell embryos from the groups indicated. G&N, mKSOM culture medium plus Gne140 and NMN; G&N-L, mKSOM culture medium without lactate plus Gne140 and NMN; G&N-L + Lac-CoA, zygotes injected into 1 mM Lac-CoA and cultured in mKSOM medium without lactate plus Gne140, NMN. (H) Violin plot showing the significantly upregulated expressions of major ZGA genes with H3K18lac enrichment. (I) Metaplot showing the higher Pol II loading on the locus of major ZGA genes with H3K18lac enrichment. Differences between means were calculated using two-tailed Student's t-test.

