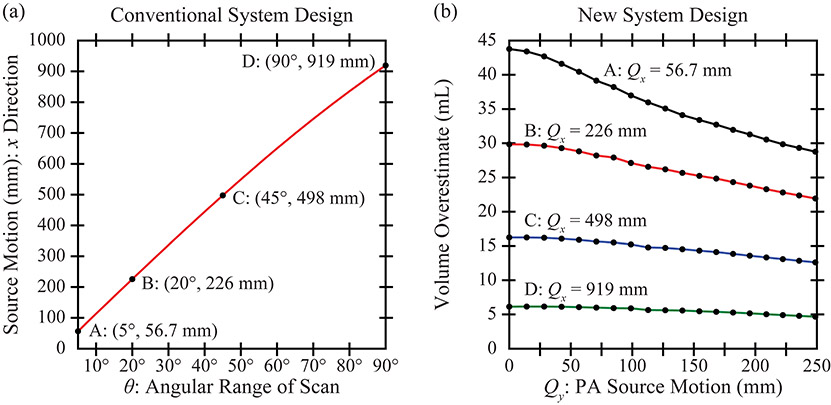
Figure 5.
(a) This plot analyzes how the net motion of the source varies with the angular range of the scan. (b) The NGT design is simulated with source motion in the (PA) direction. Increasing the range of source motion in either the or direction improves the accuracy of the breast outline segmentation.

