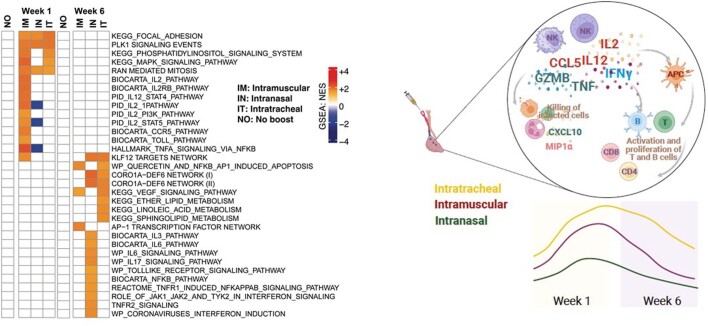
Extended Data Fig. 10. Additional transcriptomics analyses in the BAL.
The heatmap (left) illustrates the normalized enrichment scores (NES) of pathways for different groups at weeks 1 and 6 following immunization relative to the no boost group. The colour scale represents the NES, ranging from downregulated pathways (blue) to no change (white) to upregulated pathways (orange). The colour intensity reflects the strength of the enrichment score, with darker colours indicating stronger upregulation or downregulation. Pathways were selected using a GSEA nominal P-value of 0.05. P-values were corrected for multiple testing using the false discovery rate FDR cutoff of 0.05. n = 40 biologically independent animals were included in this analysis. The summary cartoon (right) shows that IT boosting led to robust and sustained activation of cytokine, NK, T and B cell pathways in the lung for at least 6 weeks. The diagram was created using BioRender.

