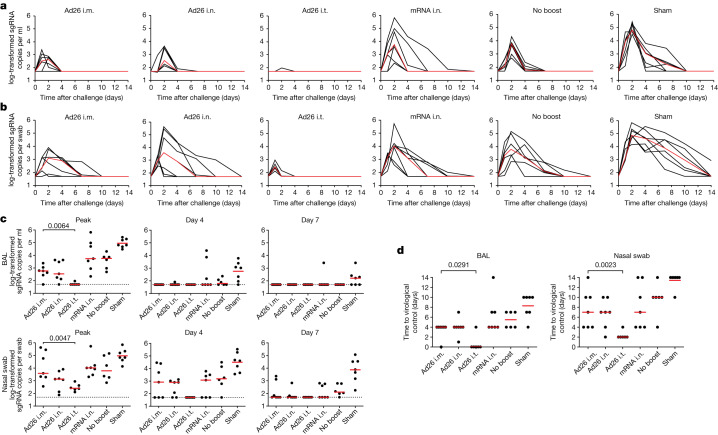
Fig. 5. Viral loads after SARS-CoV-2 BQ.1.1 challenge.
a,b, log-transformed sgRNA copies per ml in BAL (a) and log-transformed sgRNA copies per swab in nasal swabs (b) after SARS-CoV-2 BQ.1.1 challenge. Median (red lines) values are shown. c, log-transformed sgRNA copies per ml in BAL and nasal swabs at peak, day 4 and day 7 after SARS-CoV-2 BQ.1.1 challenge. d, The number of days to undetectable viral loads in the BAL and nasal swabs. The dotted lines represent the limits of quantification. Median (red bars) values are shown. The primary objective of the study was to compare the protective efficacy of Ad26 i.t. versus Ad26 i.m. boosting against SARS-CoV-2 challenge; these groups were therefore compared using two-sided Mann–Whitney U-tests and P values are shown. n = 40 biologically independent macaques.

