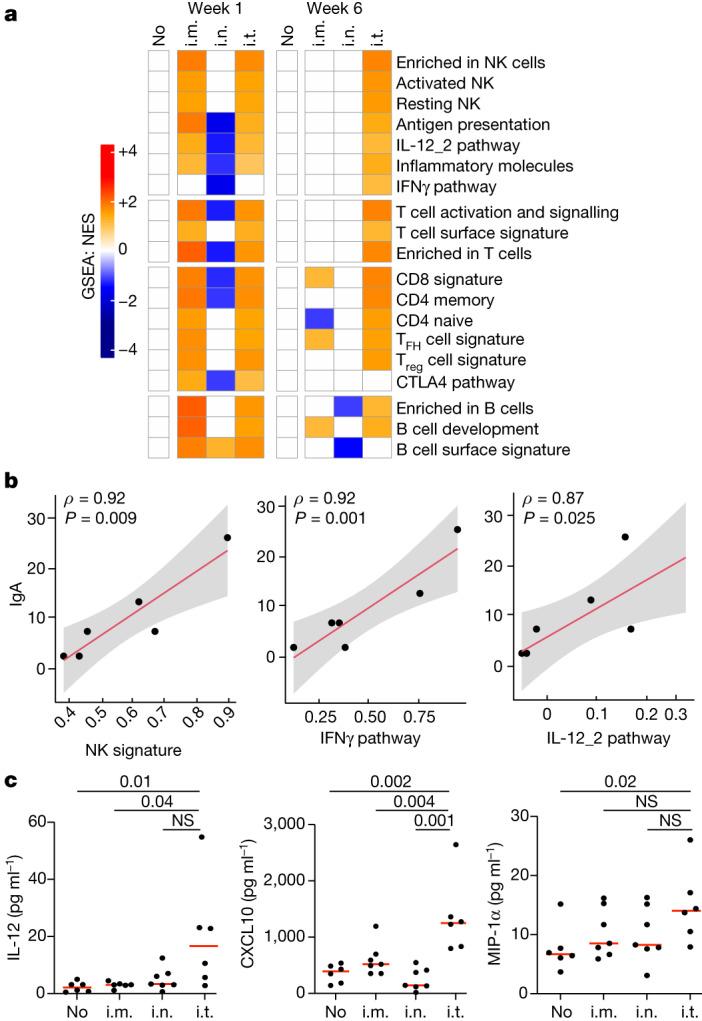
Fig. 6. Transcriptomics and cytokine analyses in the BAL.

a, Gene set enrichment analysis (GSEA) normalized enrichment scores (NES) of pathways for different groups at week 1 and week 6 after immunization relative to the no-boost (no) group. The colour scale represents the NES, ranging from downregulated pathways (blue) to no change (white) to upregulated pathways (orange). The colour intensity reflects the strength of the enrichment score, with darker colours indicating stronger upregulation (red) or downregulation (blue). Pathways were selected using a GSEA nominal P value of 0.05. P values were corrected for multiple testing using a false-discovery rate cut-off of 0.05. n = 40 biologically independent macaques. TFH, T follicular helper cells; Treg, regulatory T cells. b, Sample-level scores (sample-level enrichment analysis (SLEA)) for NK, IFNγ and IL-12_2 pathways at week 6 after i.t. boosting correlated with the IgA titres at week 12. Correlation analyses were performed using two-tailed Spearman correlation tests and simple linear regression. Lines of best fit (red line) and 95% confidence intervals (grey shading) are shown. n = 6 biologically independent macaques. c, IL-12, M1P-1a and CXCL10 levels in the BAL at week 6 were compared between groups using two-sided Mann–Whitney U-tests; P values are shown. n = 28 biologically independent macaques. NS, not significant.
