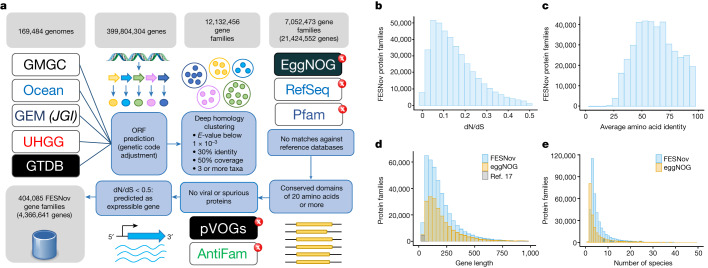
Fig. 1. Gene family discovery pipeline and general statistics.
a, Workflow used to identify FESNov gene families. ORF, open reading frame. b, dN/dS ratio in FESNov gene families. c, Distribution of average protein amino acid identity of FESNov gene families. d, Comparison between protein length distribution of FESNov gene families (blue bars), all bacterial and archaeal eggNOG orthologous groups (yellow bars) and the small peptides reported in Sberro et al.17 (grey bars). e, Distribution of species count per family for the FESNov catalogue (blue bars) compared with bacterial and archaeal eggNOG orthologous groups (yellow bars).

