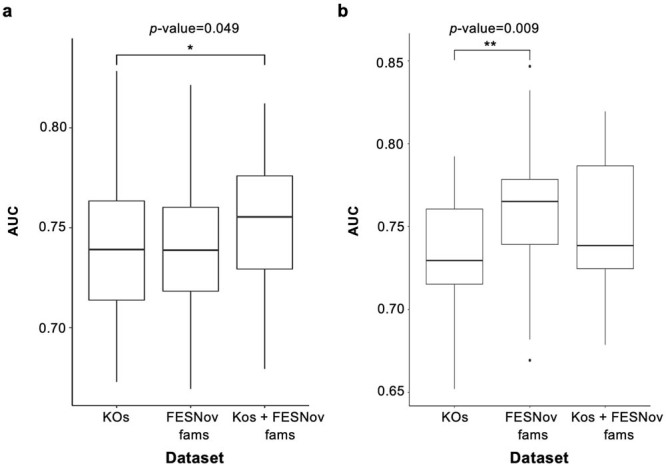
Extended Data Fig. 9. Performance of predictors built upon the relative abundance matrices of both FESNov gene families and KEGG Orthologs (KOs) families.

(a) Area Under the Curve (AUC) values obtained from 50 iterations of a logistic regression model built on KEGG Orthologs (KOs), FESNov gene families, and the combination of both (b) AUC values obtained from 30 iterations of a random forest model built on KOs, FESNov gene families and the combination of both, Data are represented as boxplots where the middle line is the median, the lower and upper hinges correspond to the first and third quartiles, the upper whisker extends from the hinge to the largest value no further than 1.5 × IQR from the hinge (where IQR is the interquartile range) and the lower whisker extends from the hinge to the smallest value at most 1.5 × IQR of the hinge, while data beyond the end of the whiskers are outlying points that are plotted individually. p-values by two-sided Wilcoxon-test are indicated.
