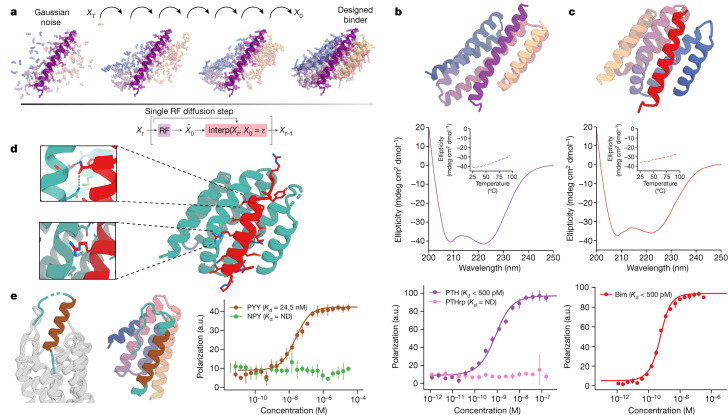
Fig. 3. De novo peptide binder design with RFdiffusion.
a, Schematic showing peptide binder design using RFdiffusion. Starting from a random distribution of residues around the target peptide (XT), successive RFdiffusion denoising steps progressively remove the noise leading at the end of the trajectory to a folded structure, X0, cradling the peptide. At each step t, RFdiffusion predicts the final structure pX0 given the current noise sample Xt, and a step that interpolates in this direction is taken to generate the input for the next denoising step Xt−1. b, Design of picomolar-affinity PTH binder. Top: design model of PTH binder (spectrum, AF2 metrics in Supplementary Table 9). Middle: circular dichroism data show that the binder has helical secondary structure and is stable at 95 °C (inset). Bottom: FP measurements (n = 4) with PTH indicate a subnanomolar binding affinity and no binding to PTHrp indicates high specificity. c, Design of picomolar-affinity Bim binder. Top: design model of Bim binder (spectrum, AF2 metrics in Supplementary Table 9). Middle: circular dichroism data show that the binder has helical secondary structure and is stable at 95 °C (inset). Bottom: FP measurements (n = 4) with Bim indicate a subnanomolar binding affinity. d, Crystal structure of Bim binder (teal and red). Top inset: a cross-interface hydrogen-bond network formed between Asn20 of Bim and Thr73 and Asn77 of the binder. Bottom inset: a kinked helix in the diffused backbone accommodates Arg13 of Bim. e, RFdiffusion with PYY sequence input alone. Left: PYY in complex with its native NPY Y2 receptor37 (PDB ID: 7YON) shows flexibility at its N and C termini (teal). Middle: design model of the binder (spectrum) with PYY target (brown); the peptide is more ordered in both regions (N terminus, teal). Right: FP measurements (n = 4) with PYY indicate a 24.5 nM binding affinity.

