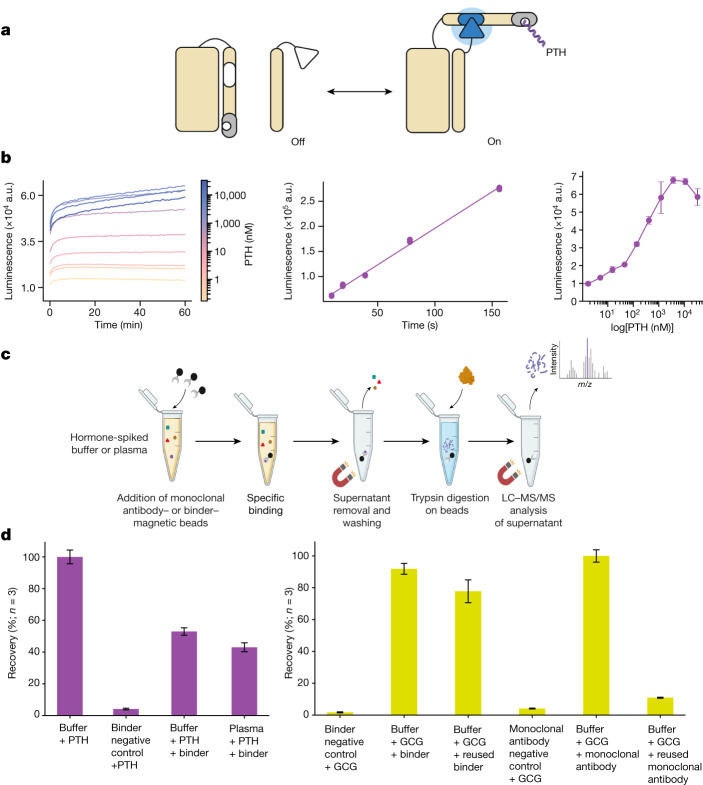
Fig. 4. Application of designed binders to sensing and detection.
a, The PTH lucCage biosensor. Cage and latch (left, beige), key (right, beige) and the PTH binder (grey) thermodynamically shift from the off to on state in the presence of PTH peptide target (purple). This conformational change brings two luciferase halves (inactive in white, active in blue) close together leading to luminescence. b, Left: titration of PTH results in luminescence increase (n = 3). Middle: response of lucCagePTH biosensor in the linear concentration range, indicating a 10 nM limit of detection (Supplementary Methods). Right: titration curve of 10 nM lucCagePTH + lucKey to various concentrations of PTH (n = 3). c, LC–MS/MS enrichment experiment schematic; the trypsin digestion step was skipped for the GCG binder. d, Left: LC–MS/MS recovery percentages for triplicate measurements of an N-terminal tryptic peptide of PTH. The negative control comprised bovine serum albumin mixed with PTH in a buffer solution. Right: recovery percentage for triplicate measurements of intact GCG peptide normalized to the percentage recovery with a monoclonal antibody (n = 3). Following the first binding and elution experiments, beads were extensively washed and resuspended in PBS–CHAPS 0.1%, and then used in a second pulldown experiment. An unrelated binder attached to the magnetic beads mixed with GCG in buffer was used as a negative control. a,c, Created with BioRender.com.

