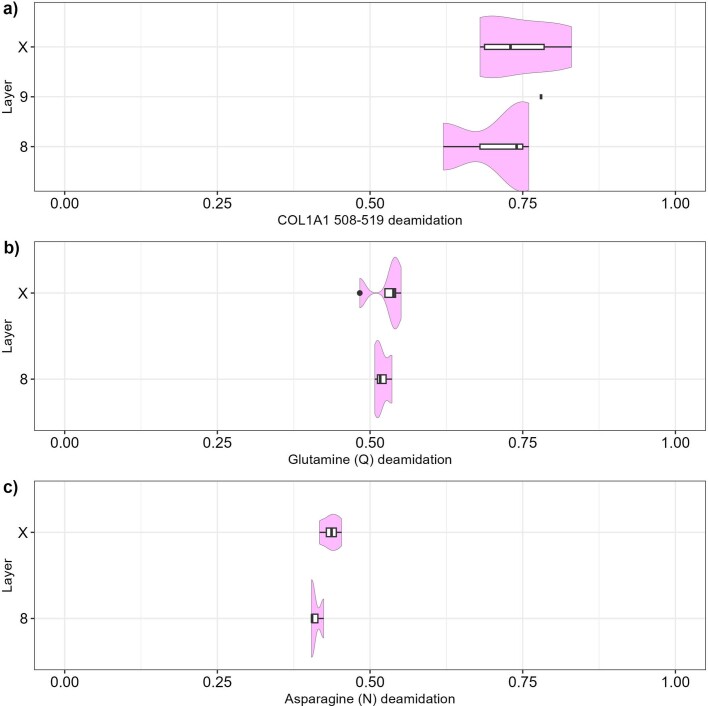
Extended Data Fig. 4. Protein deamidation for all hominin specimens in Ranis.
a) Deamidation rate of COL1A1 508–519 for hominin specimens in the 2016–2022 and 1932–1938 excavations with ZooMS (layer X, n = 4 NISP; layer 8, n = 3; layer 9, n = 1), b) Glutamine (Q) deamidation plot for hominin specimens in the 2016–2022 and 1932–1938 excavations analysed with directDIA SPIN (layer X, n = 4; layer 8, n = 3), and c) Asparagine (N) deamidation plot for hominin specimens in the 2016–2022 and 1932–1938 excavations analysed with directDIA SPIN (layer X, n = 4; layer 8, n = 3). The hominin specimen recovered from layer 9 was not included in the SPIN analysis (plots b and c). For panel a, 1 indicates no deamidation of N or Q, while 0 indicates complete deamidation of N or Q. For panels b and c, 0 indicates no deamidation of N or Q, while 1 indicates complete deamidation of N or Q. The box plots within the violin plots define the range of the data (whiskers extend to 1.5× the interquartile range), outliers (black dots, beyond 1.5× the interquartile range), 25th and 75th percentiles (boxes), and medians (centre lines).

