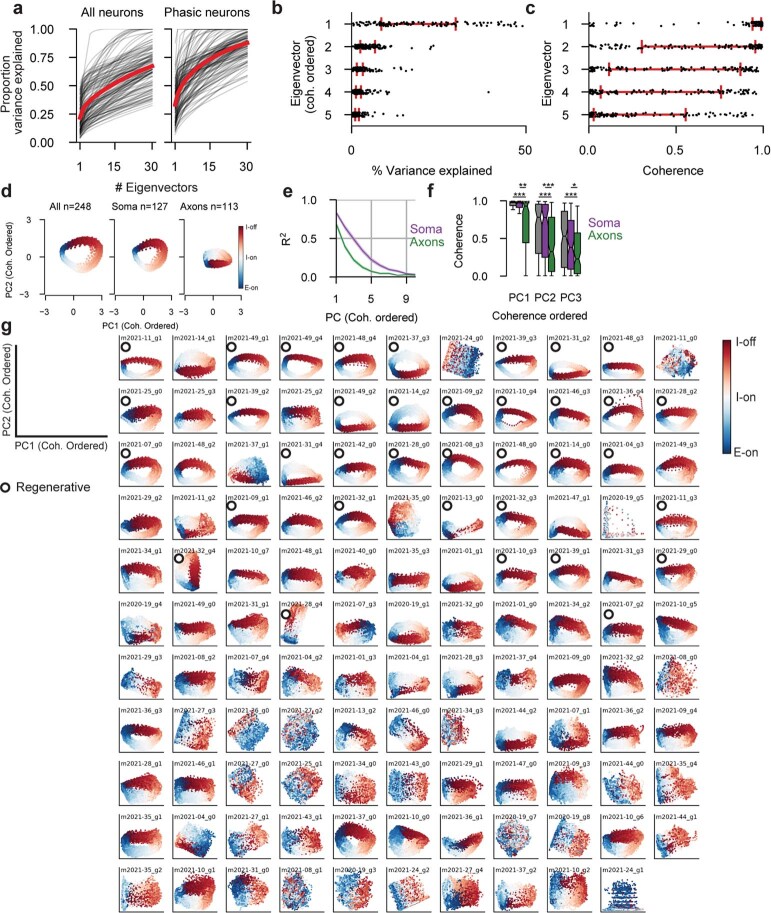
Extended Data Fig. 4. PCA decompositions of simultaneously recorded neural populations.
(a) Cumulative explained variance as a function of number of PCs included. Black lines are individual recordings, red lines are mean across all recordings. Left is PCA decompositions which include all neurons, right is PCA decompositions that include only phasic neurons (Clb > 0.1). (b) We reorder the PCs not by their eigenvalue but by the coherence of the PC with breathing in order to compare across recordings. The percent variance explained for eigenvectors in descending order of coherence is shown. After re-ordering the PCs, on average the eigenvectors decrease in their explained variance ratio monotonically, suggesting that the coherence re-ordered PCs still capture a large amount of the variance of the neural population in the leading PCs. Black dots are individual recordings, red error bars are median +/- IQR (c) Similar to (b) we show the coherence value for the leading five eigenvectors (now ordered by eigenvalue). On average, the leading eigenvectors are most coherent with breathing. (d) Example trajectories for a recording using all units (left), only somatic units (middle), or only axonal units (right). (e) R2 between somatic only (purple) or axonal only (green) PC projections with all recorded units. Shaded region is mean +/- S.E.M. (f) Coherence of the first three PCs with breathing for all recorded units (grey), somatic only units (purple), or axonal only units (green) Soma only PCs are not less coherent than full PCs, but axonal PCs are (One-way RM ANOVA n = 114 recordings. PC1: F(1.503,169.8)=11.1, p = 0.002; PC2:F(1.809,204.4)=28.07, p < 0.0001; PC3: F(1.652,186.7)=11.55, p < 0.0001. Tukey’s multiple comparisons post-hoc test *p < 0.05,**p < 0.01 ***p < 0.001). Boxes are mean +/- 1 quartile, whiskers are +/- 1.5 IQR. (g) Projections of population activity onto the two most coherent PCs for all recordings. Many recordings exhibit similar rotational structure that is highly consistent. Further, most recordings show a strong mapping between position on the manifold and respiratory phase (red->blue). Circles indicate recordings that were also regenerative in the rSLDS models.

