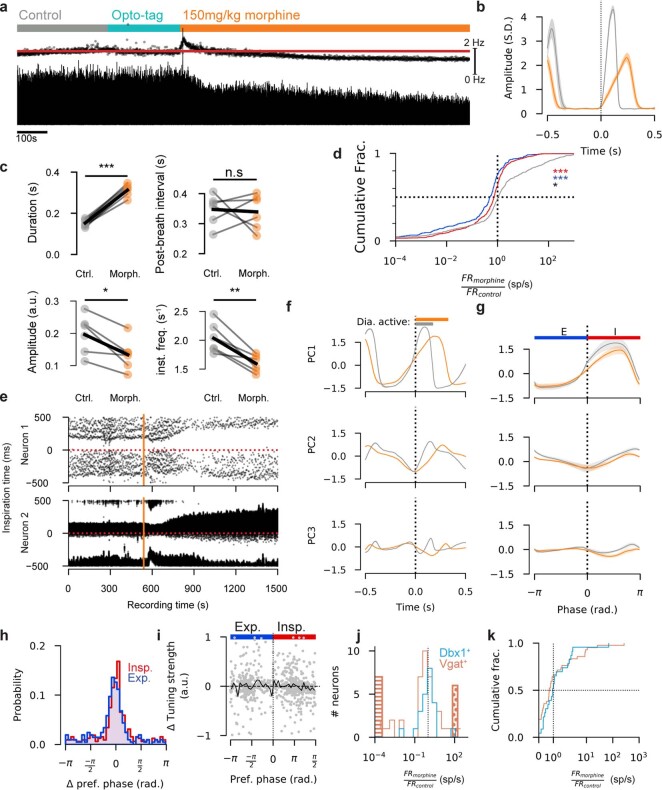
Extended Data Fig. 6. Neural population responses to morphine administration.
(a) Example integrated diaphragm trace before and after morphine administration. Top scatter is instantaneous respiratory rate. Red line is average respiratory rate in control period. Scale bar for respiratory rate is right (0–2Hz). (b) Average breath onset aligned diaphragm activity in control and morphine. Shaded regions are mean ± S.E.M. (c) Changes in diaphragm amplitude, burst duration, respiratory frequency, and post-breath interval as a result of morphine administration for all recordings (n = 6) (two-sided paired t-test; duration ***p = 1.8e-5; post-burst interval p = 0.82; *amplitude p = 0.01; **instantaneous frequency p = 0.005) (d) Cumulative probability distribution of the ratio of firing rates in morphine to firing rates in control, for all recorded neurons. On average, inspiratory (n = 594) and expiratory (n = 245) units have reduced firing rates, while tonic units (n = 771) have higher firing rates (two-sided Wilcoxon rank-sum test p = 7.01e-5, p = 4.97e-15, p = 0.020 respectively) (e) Breath onset aligned rasters for example expiratory (top) and inspiratory (bottom) units over the course of morphine administration. X-axis is time in the recording of a given breath, y-axis is breath onset aligned spike time. Red dashed horizontal line is breath onset time. Each column is a breath, and each dot is a spike. Morphine is administered at the vertical orange line. (f) Breath onset aligned average of the first 3 PCs of neural population in control and morphine for an example recording. Morphine dramatically slows the evolution of the population activity. (g) Phase-aligned average PCs of neural population across all recordings. Shaded region is mean ± S.E.M. Phasic structure of the PCs is preserved in morphine, with a slight reduction in amplitude of PC1. (h) Histogram of change in preferred phase of all recorded neurons. (i) Change in respiratory tuning strength as a function of preferred phase. Each dot is a neuron, solid black line is the mean change in tuning strength. Units with fewer than 1 spike per breath are excluded in h and i. (j) Histogram of firing rate ratio for optogenetically tagged units. Units that are completely silenced in morphine are shown in horizontal hatching; units that are silent in control and not in morphine are shown in dot hatching. (k) Cumulative distribution of FRratio for optogenetically identified neurons.

