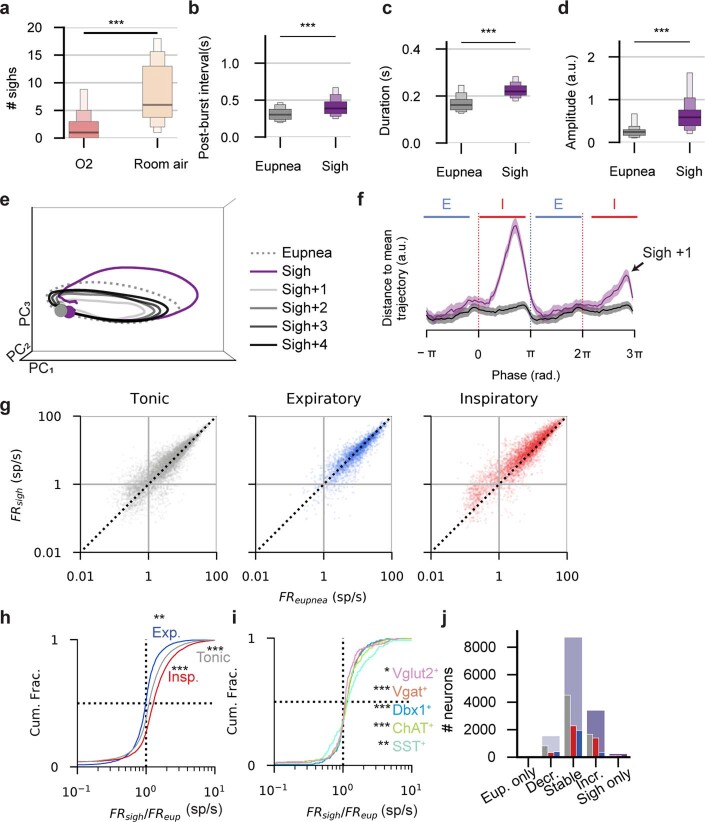
Extended Data Fig. 9. Neural population changes during sighing.
(a) Average number of sighs observed in 100% O2 and in room air across all recordings with both room air and O2 presentations (two-sided Wilcoxon rank-sum test ***p = 1.3e-14, n =116 recordings). (b) Average post-burst interval (time from breath cessation to onset of next breath), (c) breath duration, and (d) breath amplitude are increased during sighs (two-sided paired t-test ***p < 0.001, n = 126 recordings; (b) p = 2.0e-22, (c) p = 3.6e-22, (d) p = 3.5e-21). (e) Mean neural PC trajectories as in Fig. 6f, but including the first through fourth eupnea after the sigh. Recovery to a normal eupneic trajectory takes several breaths after a sigh. (f) Distance to mean eupnea trajectory as in Fig. 3i, averaged across all recordings and breaths. Shaded region is mean ± S.E.M. Distance from sigh to eupnea shown in purple. (g) Firing rates for all units across all recordings during eupnea (x-axis) and sighs (y- axis). Each dot is a unit, units are separated by their preferred phase in eupnea. Somatic and axonal units are shown (h) Cumulative probability distribution of the ratio of firing rates in sigh to firing rates in eupnea (FRratio), for all recorded units. All units are right shifted (that is, recruited) during sighs (two-sided, 1-sample t-test on log firing rate ratio; expiratory: n = 2,905 units, p = 0.002; inspiratory n = 4,453 units, p = 2.26e-233; tonic n = 7,716 units, p = 7.3e-90). (i) As in (h) for neurons of optogenetically identified as indicated by color. All subgroups units are on average recruited during a sigh (two-sided 1 sample t-test on log firing rate ratio; Vglut2+ n = 192, *p = .034; ChAT+ n = 156,***p = 6.6e-6; Vgat+ n = 334, ***p = 2.33e-6; Dbx1+ n = 346, ***p = 6.04e-12; SST+ n = 106, **p = 0.003). (j) Neurons are categorized by the FRratio as being eupnea only (FRratio<0.2), sigh decreasing (0.2 ≤ FRratio < 0.7), stable (0.7 ≤ FRratio < 1.5), sigh increasing (1.5 ≤ FRratio < 5), or sigh only (5 ≥ FRratio). The total number of neurons in each category are shown in purple, and are subdivided by inspiratory, expiratory, and tonic. Boxen plots are median, boxes are median ± first, second, and third quantile respectively.

