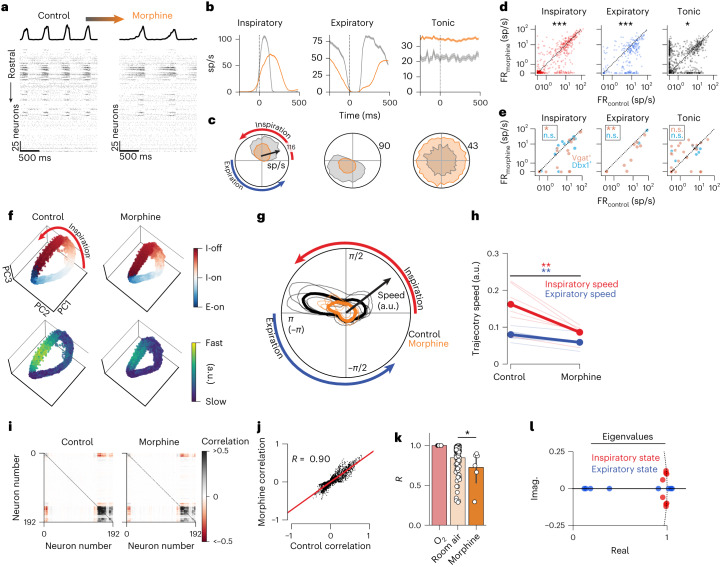
Fig. 5. Opioids cause temporal restructuring of respiratory neural activity, but do not alter rotational dynamics.
For all panels, gray is control and orange is morphine. a, Example rasters and diaphragm activity before (left) and after (right) intraperitoneal administration of 150 mg kg−1 morphine. b,c, Breath onset- (b) and phase- (c) aligned average activity of three example units in control and after morphine administration. Top half of circle is inspiration; bottom half is expiration. Mean firing rate ± s.e.m. is shown. sp/s, spikes/second. d, Firing rates of inspiratory (red, n = 594), expiratory (blue, n = 245) and tonic (black, n = 771) units before (x axis) and after (y axis) morphine administration. Two-sided Wilcoxon rank sum test: P = 7.0 × 10⁻⁵, 4.97 × 10⁻¹⁵ and 0.020, respectively. e, Firing rates of optogenetically tagged units (blue: Dbx1+ n = 23, orange: Vgat+ n = 57) separated by respiratory firing pattern (two-sided Wilcoxon rank-sum test; Vgattonic P = 0.99, Vgatinsp *P = 0.01, Vgatexp **P = 0.002, Dbx1tonic P = 0.30, Dbx1insp P = 0.57, Dbx1exp P = 0.50). f, Low-dimensional population projections onto the leading three PCs. Each dot is a 5-ms bin. Top row color indicates phase; bottom row color indicates trajectory speed. g, Angular plot of trajectory speed (radial axis) as a function of breathing phase (angular axis) for all recordings. Individual recordings are thin traces; means across all recordings are thick traces. h, Average speed during inspiratory phase (red) or expiratory phase (blue) in control versus morphine (two-sided paired t-test expiratory P = 0.007, inspiratory P = 0.002, n = 6). Individual recordings are thin traces; means are thick traces. Trajectory speed units are arbitrary. i, Correlation of each pair of recorded units in control (left) and morphine (right), ordered by ward clustering. j, Correlation value of each pair of units before (x axis) and after (y axis) morphine administration. Each dot is a pair of units. k, Linear fit (R value) of the pairwise correlation values in O2 compared to room air and during morphine administration. Each dot is a recording; error bars are 95% confidence interval. We consider room air as a control change in correlation structure as compared to O2. Changes in population correlation structure after morphine administration are modestly different than those observed in room air (two-sided Mann–Whitney U test P = 0.026, nroomair = 116, nmorphine = 6). l, Real and imaginary components of the eigenvalues for the dynamics matrices that govern the inspiratory and expiratory states in the rSLDS models fit during OIRD. Only recordings in which the dynamics were regenerative during control eupnea (n = 4) are shown. Dashed line is the unit circle.

