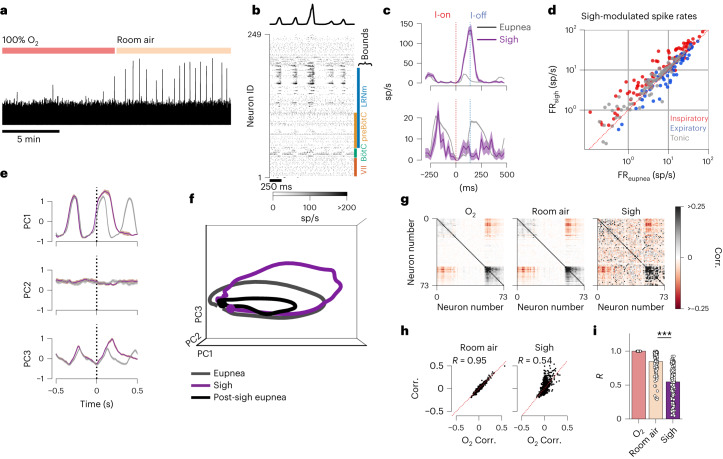
Fig. 6. Sighs are inspiratory excursions that disrupt subsequent breaths.
a, Integrated diaphragm trace over 20 min shows increased frequency of sighs during room air presentation. b, Example spike raster and diaphragm activity before and after a sigh. Approximate rostral–caudal boundaries of some landmark medullary regions are shown. c, Breath onset-aligned average activity of two example units (mean firing rate (FR) ± s.e.m.) for eupnea (gray) and sighs (purple). Firing rate of top unit increases and bottom unit decreases during the sigh. sp/s, spikes/second. d, Firing rates of all units recorded in b for eupnea (x axis) and sighs (y axis). Each dot is a recorded unit. Color indicates preferred phase of firing during eupnea: inspiratory (red), expiratory (blue) or tonic (gray). e, Breath onset aligned average of the leading three PCs in eupnea (gray) and sighs (purple) for an example recording. Shaded region is mean ± s.e.m. f, Average population trajectories through PC space for the recording in e for eupnea (gray), sighs (purple) and the breath after a sigh (black). g, Correlation values for all pairs of units during eupnea in O2, room air, and during sighs. Red is strong negative correlations; black is strong positive correlations. h, Correlation (Corr.) value of each pair of units during O2 presentation (x axis) against those during room air presentation (y axis, left) and during sighs (y axis, right). i, Linear fit (R value) of the pairwise correlation values in O2 compared to room air and sighs. Each dot is a recording; error bars are 95% confidence interval. We consider room air as a control change in correlation structure as compared to O2. Changes in population correlation structure during sigh are different than those observed in room air (two-sided Mann–Whitney U test ***P = 1 × 10⁻²², nrecs_roomair = 116, nrecs_sigh = 121).

