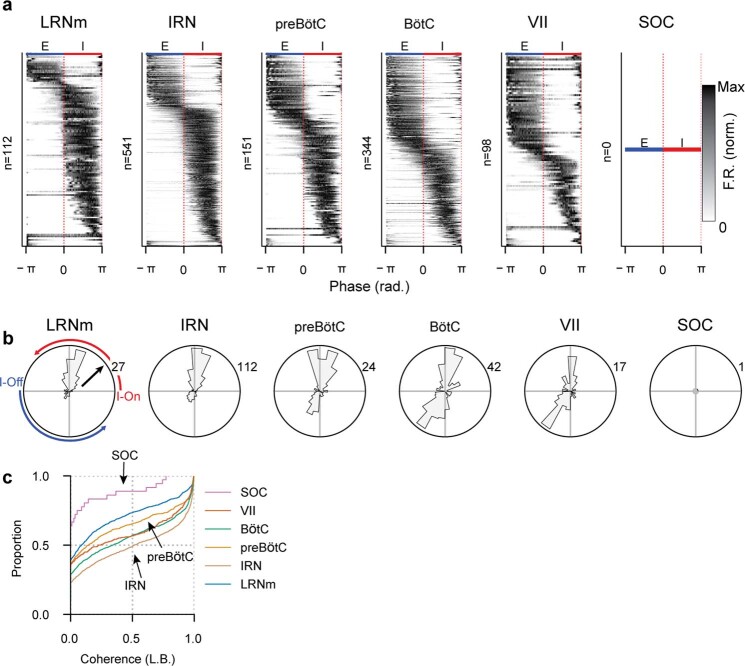
Extended Data Fig. 1. Phasic activity patterns of strongly coherent somatic units parcellated by VRC sub-regions.
(a) Phase-averaged, maximum normalized activity of all strongly coherent (Clb>0.9) somatic units found in each VRC subregion. As expected, no superior olivary complex (SOC) neurons are strongly coherent. Regions are arranged from caudal (left) to rostral (right). Proportionally more units are expiratory in more rostral regions. (b) Angular distribution of units with a given phase lag (ϕ) with respect to breathing, for all regions in (a). Angular axis is respiratory phase, radial axis is number of units with a given ϕ value. Inspiration is top half of circle (ϕ > 0), expiration is bottom half of circle (ϕ < 0) (c) Cumulative distributions of the Clb values for all somatic units in each region. Rightward shifted curves indicate a higher proportion of coherent units.

