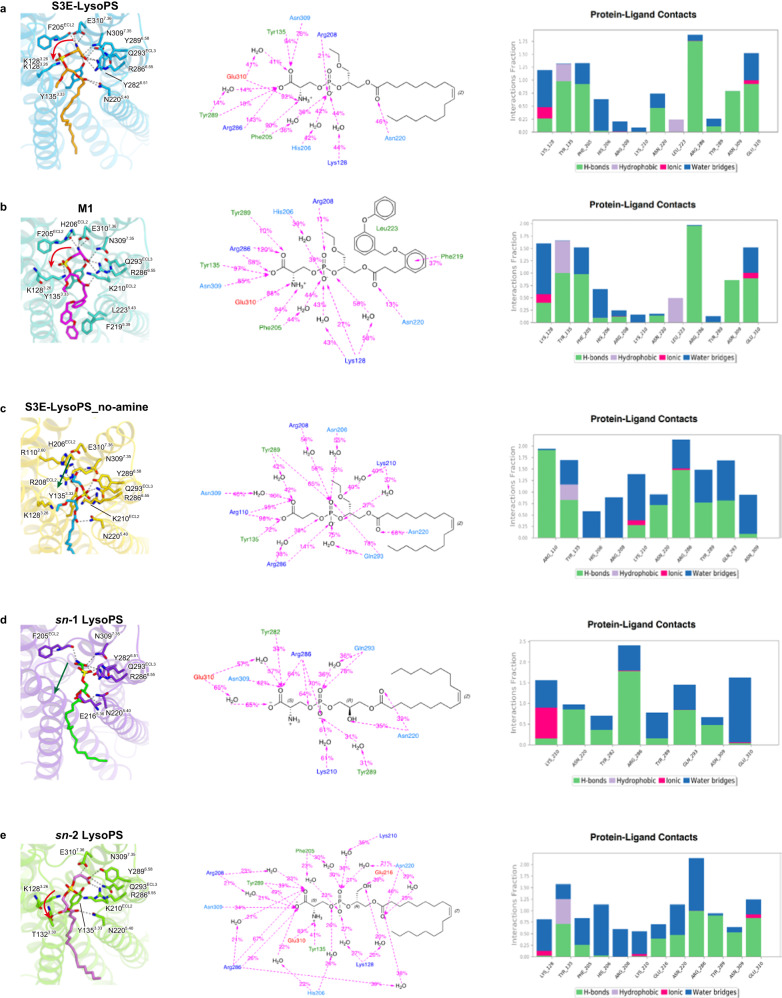
Fig. 4. Molecular dynamics (MD) simulations.
a–e Average structures and maintained ligand-protein (P–L) interactions during 1-µs MD simulations. The interactions were illustrated in percentage (percentage = number of framesinteraction present /number of framestotal). Middle panels: orange, negatively charged residues; blue, positively charged residues; cyan, polar residues; green, hydrophobic residues. Right panels: green, hydrogen bond; grey, hydrophobic interaction; magenta, ionic interaction; blue, salt bridge. In the cases of S3E-LysoPS (a) and M1 (b) bound GPR34 complexes, we showed the P–L interaction corresponding to mutagenesis results. In the cases of S3E-noamine, sn-1, and sn-2 LysoPS bound GPR34 complexes, only P–L interactions conserved over 50% were shown.

