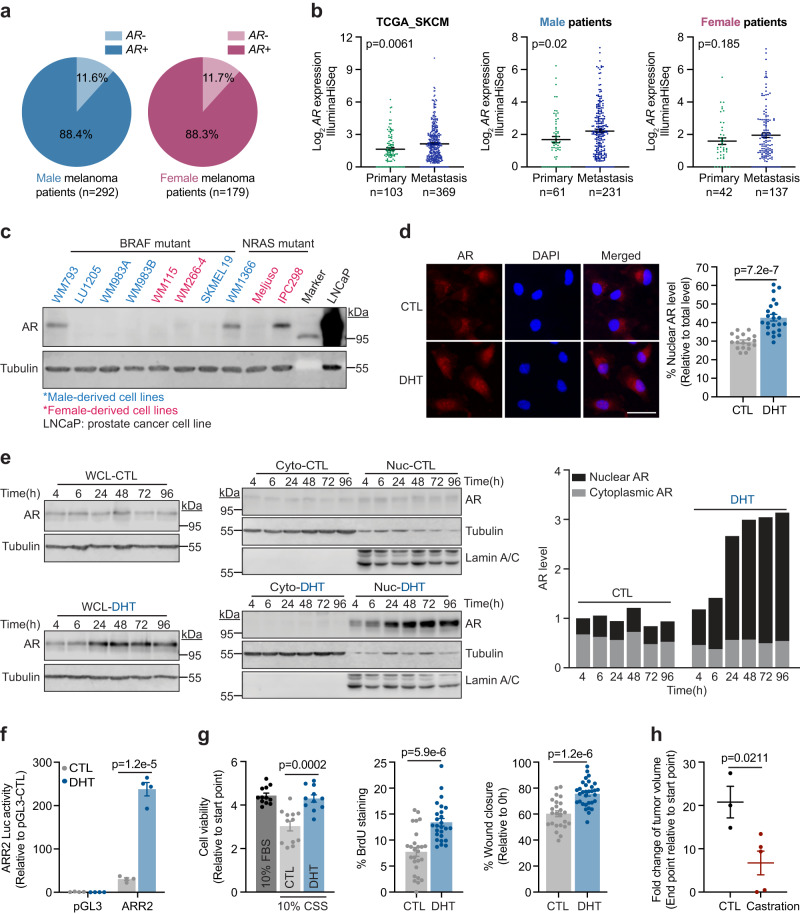
Fig. 1. Melanomas express androgen-inducible, transcriptionally active AR, which drives proliferation and motility.
AR mRNA levels in a male vs. female or b primary vs. metastatic melanoma tissues from the TCGA skin cutaneous melanoma dataset (TCGA_SKCM; n = 473). c Immunoblotting (IB) analysis of baseline AR protein levels across 10 human melanoma cell lines. LNCaP prostate cancer cell line serves as a positive control for AR expression. Uncropped blots in Source Data. d Immunofluorescence (IF) staining of AR protein in WM793 cells treated ± 100 nM dihydrotestosterone (DHT) for 8 h. CTL, n = 18 fields; DHT, n = 23 fields examined over 3 independent experiments. Scale bar = 50 μm. e Whole cell lysate (WCL; left) and subcellular fractionation (center) IB of AR protein in WM793 cells treated with vehicle (CTL; upper) or 100 nM DHT (lower) over 96 h. For subcellular fractionation blots, tubulin and lamin A/C indicate cytoplasmic (Cyto) and nuclear (Nuc) fractions, respectively. Stacked column chart (right) shows quantified subcellular localization of AR protein from the blots (left and center). Uncropped blots in Source Data. f ARR2 luciferase reporter assay of WM793 cells treated ± 100 nM DHT for 48 h (n = 4 biologically independent samples). g (left) MTT assay of WM793 cells cultured in 10% fetal bovine serum (FBS) or 10% charcoal-stripped serum (CSS) ± 100 nM DHT for 4 days (10% FBS, n = 12; CTL, n = 12; DHT, n = 11 biologically independent samples). (center) BrdU staining (n = 26 fields examined over 3 independent experiments) and (right) scratch migration assay (CTL, n = 24 scratches; DHT, n = 32 scratches examined over 3 independent experiments) of WM793 cells treated ± 100 nM DHT for 48 h. h The fold-change of SM1 tumor volume in C57BL/6 mice at the end point (35 days after implantation). Mice were castrated at 1.5 weeks prior to injection (CTL, n = 3 mice; Castration, n = 5 mice). For b, d, f–h, data are presented as mean values ± standard error of the mean (SEM) and p-values are calculated by two-sided Student’s t-test. Source data are provided as a Source Data file.

