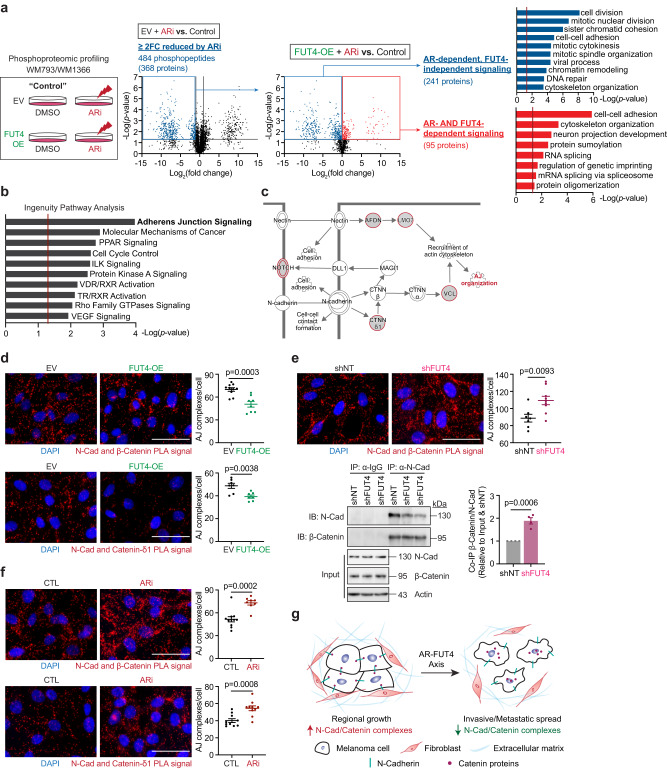
Fig. 3. AR regulates melanoma motility/invasion in a FUT4-dependent manner and regulates melanoma proliferation in a FUT4-independent manner.
a (left) Global phosphoproteomic profiling of EV vs. FUT4-overexpressing (OE) melanoma cells treated with 10 μM ARi for 48 h. Volcano plots showing phosphopeptides identified by LC-MS/MS to be ≥2-fold-change (FC) reduced by ARi (center left) that are or are not rescued by FUT4-OE (center right). p-values are calculated by two-sided Student’s t-test. DAVID pathway analysis identifying the enrichment of cell division-related signaling as AR-dependent, FUT4-independent (upper right) vs. cell adhesion-related signaling as AR- and FUT4-dependent (lower right). In DAVID, one-sided Fisher’s Exact test is adopted to measure the gene-enrichment in annotation terms. b Ingenuity Pathway Analysis (IPA) highlighting AR-FUT4-regulated protein signatures are predominantly enriched in adherens junction (AJ) signaling. p-values are calculated by one-sided Fisher’s Exact test. c Schematic diagram of AJ signaling between 2 adjacent cells (adapted from a Qiagen IPA-generated schematic). Red circles denote hits from our phosphoproteomic profiles. d In situ proximity ligation assay (PLA) for N-cadherin and catenin proteins in EV/FUT4-OE WM793 cells. N-cadherin/β-catenin PLA (upper): EV, n = 10 fields; FUT4-OE, n = 8 fields and N-cadherin/δ1-catenin PLA (lower): n = 7 fields examined over 1 independent experiment. Two other independent experiments in Source Data. Scale bar = 50 μm. e (upper) PLA and (lower) co-immunoprecipitation (co-IP) analyses evaluating the interaction between N-cadherin and β-catenin proteins in shNT/shFUT4 WM793 cells. PLA: shNT, n = 7 fields; shFUT4, n = 9 fields examined over 1 independent experiment. Two other independent experiments in Source Data. Scale bar=50μm. Co-IP: n = 4 biologically independent samples. Uncropped blots in Source Data. f PLA staining for N-cadherin and catenin proteins in parental WM793 cells treated ± 10 μM ARi for 48 h. N-cadherin/β-catenin PLA (upper): CTL, n = 11 fields; ARi, n = 8 fields and N-cadherin/δ1-catenin PLA (lower): n = 10 fields examined over 1 independent experiment. Two other independent experiments in Source Data. Scale bar = 50 μm. g Working model of AR-FUT4 axis in disrupting AJs to promote melanoma invasiveness (the schematic was created using BioRender). For d–f, data are presented as mean values ± SEM and p-values are calculated by two-sided Student’s t-test. Source data are provided as a Source Data file.

