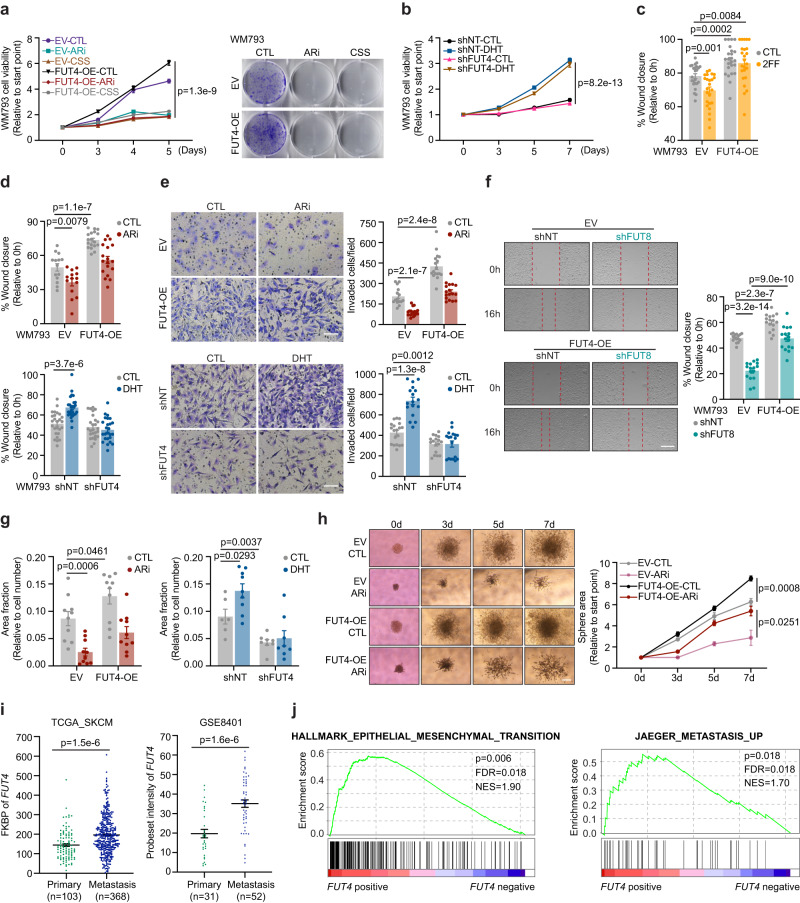
Fig. 4. FUT4 is crucial for androgen/AR-stimulated melanoma migration and invasion in vitro.
a (left) XTT assay (5 days) and (right) clonogenic assay (14 days) of EV/FUT4-OE WM793 cells treated ± 10 μM ARi or cultured in 10% CSS (XTT assay: n = 6 biologically independent samples; clonogenic assay: representative images are shown for 3 independent experiments). b XTT assay of shNT/shFUT4 WM793 cells treated ± 100 nM DHT for 7 days (n = 12 biologically independent samples). c Scratch migration assays of EV/FUT4-OE WM793 cells treated ± 250 μM 2F-peracetyl-fucose (2FF) for 3 days (n = 24 scratches examined over 3 independent experiments). d Scratch migration assay (upper: EV-CTL/ARi, n = 14 scratches; FUT4-OE-CTL/ARi, n = 18 scratches examined over 3 independent experiments. lower: shNT-CTL/DHT, n = 26 scratches; shFUT4-CTL, n = 26 scratches; shFUT4-DHT, n = 25 scratches examined over 3 independent experiments) and e Matrigel invasion assay (upper: EV-CTL, n = 15 fields; EV-ARi, n = 17 fields; FUT4-OE-CTL/ARi, n = 17 fields examined over 2 independent experiments. lower: shNT-CTL, n = 19 fields; shNT-DHT, n = 17 fields; shFUT4-CTL, n = 17 fields; shFUT4-DHT, n = 18 fields examined over 3 independent experiments) of EV/FUT4-OE WM793 cells treated ± 10 μM ARi for 48 h (upper) or shNT/shFUT4 WM793 cells treated ± 100 nM DHT for 48 h (lower). Scale bar = 200 μm. f Scratch migration assay of FUT4/FUT8 double-modified WM793 cells. n = 16 scratches examined over 3 independent experiments. Scale bar = 400 μm. g FITC-gelatin degradation assay of EV/FUT4-OE WM793 cells treated ± 10 μM ARi for 48 h (left; n = 10 fields examined over 3 independent experiments) or shNT/shFUT4 WM793 cells treated ± 100 nM DHT for 48 h (right; shNT-CTL, n = 6 fields; shNT-DHT, n = 9 fields; shFUT4-CTL/DHT, n = 8 fields examined over 3 independent experiments). h 3D spheroid cell invasion assay with EV/FUT4-OE WM793 cells treated ± 10 μM ARi for 7 days (EV-CTL, n = 7; EV-ARi, n = 3; FUT4-OE-CTL, n = 4; FUT4-OE-ARi, n = 4 biologically independent samples). Scale bar = 200μm. i Comparison of FUT4 mRNA levels between primary vs. metastatic melanomas in TCGA_SKCM and GSE8401 datasets. j GSEA illustrating the association of FUT4 expression with Hallmark_Epithelial_Mesenchymal_Transition and Jaeger_Metastasis_Up gene signatures in TCGA_SKCM samples. p-values are calculated by two-sided permutation test. FDR, false discovery rate. NES, normalized enrichment score. For a–i, data are presented as mean values ± SEM and p-values are calculated by two-sided Student’s t-test. Source data are provided as a Source Data file.

