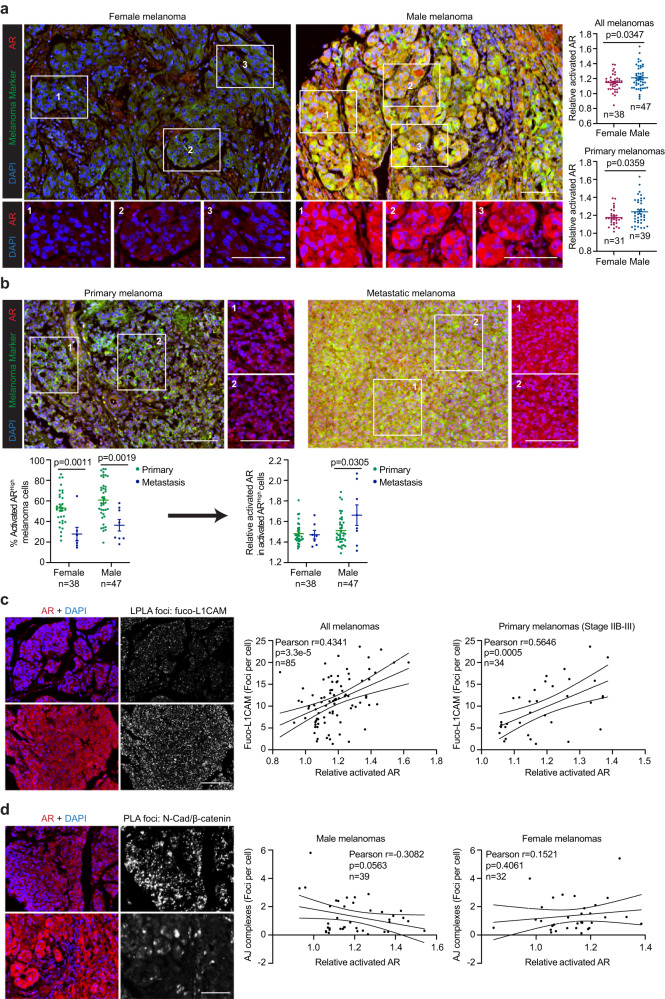
Fig. 6. The activation of AR-FUT4-regulated signaling in male melanoma tissues.
a Representative images (left) and quantification (right) of multiplexed IF staining for tumor-specific activated AR in female vs. male melanoma tissues. Relative activated AR = the ratio of nuclear/cytoplasmic AR. b Representative images (upper) and quantification (lower) comparing activated AR levels between primary and metastatic melanomas in female and male patients (high level: above median level among all melanoma cells across the whole TMA). Representative images (left) and correlation analyses (right) of c activated AR and fuco-L1CAM (LPLA foci), as well as d activated AR and N-cadherin/β-catenin junction complexes (PLA foci). For a, b, data are presented as mean values ± SEM and p-values are calculated by two-sided Student’s t-test. For c, d, p-values are determined by two-sided correlation test based on Pearson’s coefficient. All scale bars = 100 μm. Melanoma marker: a cocktail of MART-1 + Tyrosinase + gp100. Source data are provided as a Source Data file.

